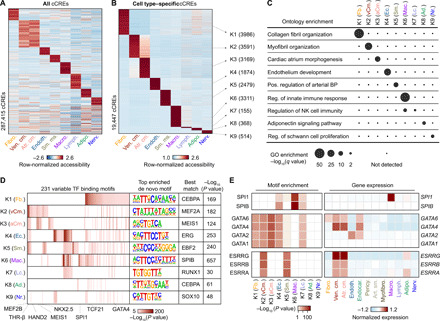
Fig. 2. Characterization of gene regulatory programs in cardiac cell types.

(A) Heatmap illustrating row-normalized chromatin accessibility values for the union of 287,415 cCREs. K-means clustering was performed to group cCREs on the basis of relative accessibility patterns. (B) Heatmap showing row-normalized chromatin accessibility of 19,447 cell type–specific cCREs (FDR < 0.01 after Benjamini-Hochberg correction; fold change > 1.2). K-means clustering was performed to group cCREs on the basis of relative accessibility patterns. Number of cCREs per K can be found in brackets. (C) Genomic Regions Enrichment of Annotations Tool (GREAT) ontology analysis (33) of cell type–specific cCREs. Q value for enrichment indicates Bonferroni-adjusted P value. NK, natural killer; GO, gene ontology; BP, blood pressure. (D) Transcription factor motif enrichment (35) for known and de novo motifs within cell type–specific cCREs. The heatmap in shows motifs with an enrichment P value of <10−5 in at least one cluster. For de novo transcription factor motifs, the best matches for the top motifs are displayed. Statistical test for motif enrichment: hypergeometric test. P values were not corrected for multiple testing. (E) Combination of transcription factor motif enrichment and gene expression shows cell type–specific roles for members of transcription factor families. Displayed are heatmaps for known motif enrichment in cell type–specific cCREs (left) and gene expression across clusters (right). (Fb., fibroblast; vCm., ventricular cardiomyocyte; aCm., atrial cardiomyocyte; Ec., endothelial; Sm., smooth muscle; Mac., macrophage; Lc., lymphocyte; Ad., adipocyte; Nr., nervous.)
