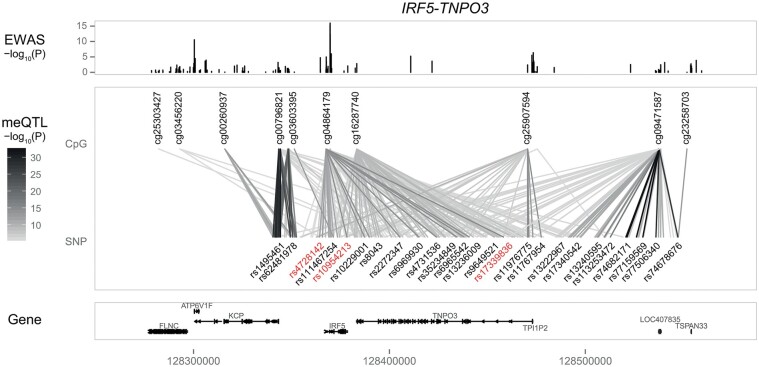
Fig. 2.
Illustration of genetic regulation of DNA methylation at the IRF5-TNPO3 pSS susceptibility locus
Data presented here are derived from meQTL analysis by Imgenberg-Kreuz et al. [73]. Top panel: Results (as –log10 P-values) of the pSS case–control EWAS of 100 pSS patients and 400 controls, with cg04864179 being the top differentially methylated CpG site within this locus. Middle panel: Significant meQTLs analysed in 382 controls, genotyped on the ImmunoChip, with the lines connecting the CpG site and corresponding SNPs in darker grey representing a stronger significance of the meQTL. GWAS index SNPs are indicated in red. Bottom panel: The RefSeq genes in the region. meQTL: methylation quantitative trait loci.

