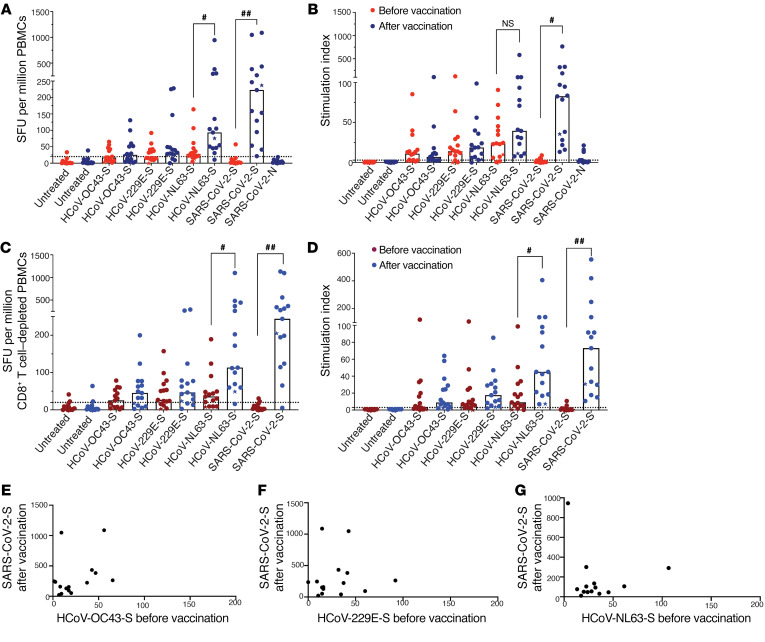
Figure 1. T cell IFN-γ responses to SARS-CoV-2 and CCCs.
The IFN-γ ELISPOT assay was performed on samples obtained from participants before and after vaccination. The SFU and stimulation indices of PBMCs (A and B) and CD8+ T cell–depleted PBMCs (C and D) in response to HCoV-NL63, HCoV-229E, HCoV-OC43, or SARS-CoV-2 peptide pools are shown. Each data point represents the mean of 3 replicate values. Horizontal bars represent the median (n = 15). The donor who received the Moderna (mRNA-1273) vaccine is indicated with a star. #P = 0.0332 and ##P = 0.0021, by 2-tailed, paired Student’s t test (E–G) Correlation between post-vaccination SARS-CoV-2 PBMC ELISPOT responses and pre-vaccination responses to HCoV-OC43, HCoV-229E, and HCoV-NL63, respectively. Pearson’s correlation test, r = 0.065, 0.36, and 0.12, respectively (n = 15).

