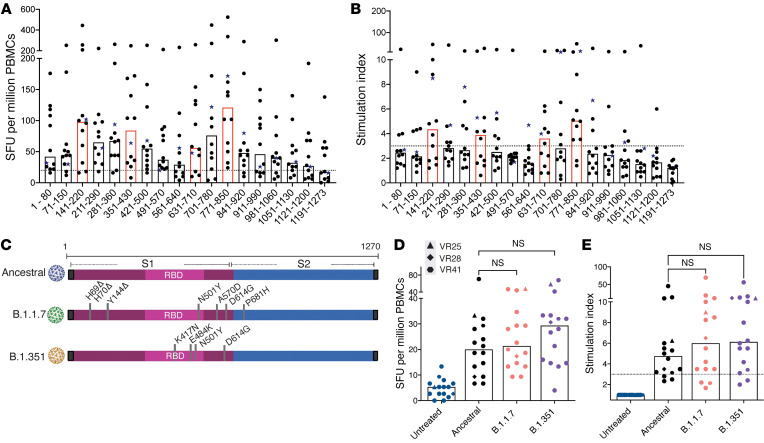
Figure 3. Breadth of T cell responses to SARS-CoV-2 spike protein and responses to spike variants.
The number of SFU per million CD8+ T cell–depleted PBMCs (A) and stimulation indices (B) generated for pools of 10 peptides are shown for 12 vaccine recipients. The donor who received the Moderna (mRNA-1273) vaccine is indicated with a star symbol. Horizontal bars indicate the median. Pools that elicited the most potent responses are highlighted in red. T cell responses to S1 subunits from ancestral SARS-CoV-2 or B.1.351 and B.1.1.7 variant spike proteins (C) were measured. The number of SFU per million CD8+ T cell–depleted PBMCs (D) and stimulation indices (E) generated are shown for 17 vaccine recipients. Horizontal bars represent the median. Statistical comparisons were performed using 1-way ANOVA with Geisser-Greenhouse correction and Dunnett’s multiple-comparison test. P = 0.0332, P = 0.0021, P = 0.0002, and P < 0.0001.

