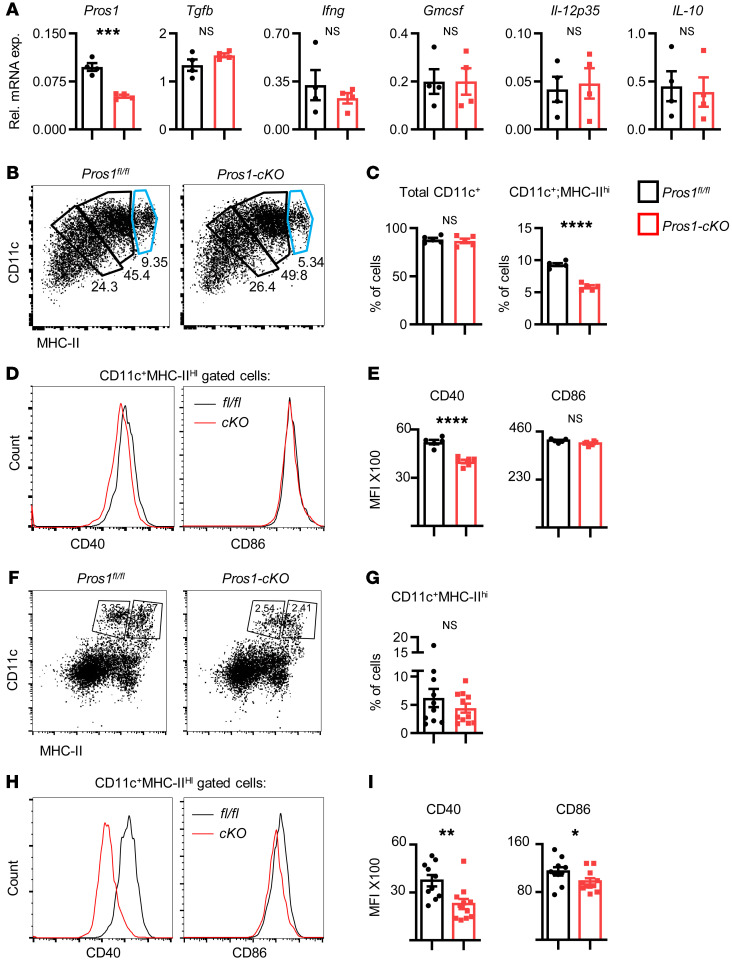
Figure 11. Impaired maturation and incomplete expression of costimulatory molecules by DCs after partial deletion of Pros1.
(A–E) Analysis of BMDCs. (A) Relative mRNA expression of the indicated cytokines in GM-CSF–induced BMDCs from Pros1fl/fl control and Pros1-cKO mice measured by RT-qPCR. Mean ± SEM; n = 4 mice/group; 2 independent experiments. ***P = 0.0002; t test. (B and C) Representative FACS plots of CD45+ gated cells analyzed for CD11c+ cells expressing different MHC-II intensities. The light blue gate indicates the MHC-IIhi cells (B) and quantification (C) of CD45+ gated cells analyzed for total CD11c and CD11c+MHC-IIhi (light blue gate). Mean percentage ± SEM; n = 4 mice/group, ****P < 0.0001; NS, nonsignificant; t test. (D) Representative histograms and quantification (E) of CD11c+MHC-IIhi gated cells (light blue gate) further analyzed for CD40 and CD86 expression. MFI ± SEM; n = 5–6 mice/group. ****P = 0.0001; t test. (F–I) Analysis of DCs from metastatic lungs. (F) Representative FACS plots and (G) quantification of CD45+ gated cells from control (Pros1fl/fl) and cKO metastatic lungs analyzed for total CD11c+MHC-IIhi cells. Mean percentage ± SEM; n = 10–11 mice/group; 2 independent experiments; t test. (H) Representative histograms and (I) quantification of CD11c+MHC-IIhi gated cells analyzed for CD40 and CD86 expression. Graphs represent the MFI ± SEM; n = 10–11 mice/group. *P =0.03 (CD86); **P = 0.003 (CD40); t test. NS, nonsignificant.

