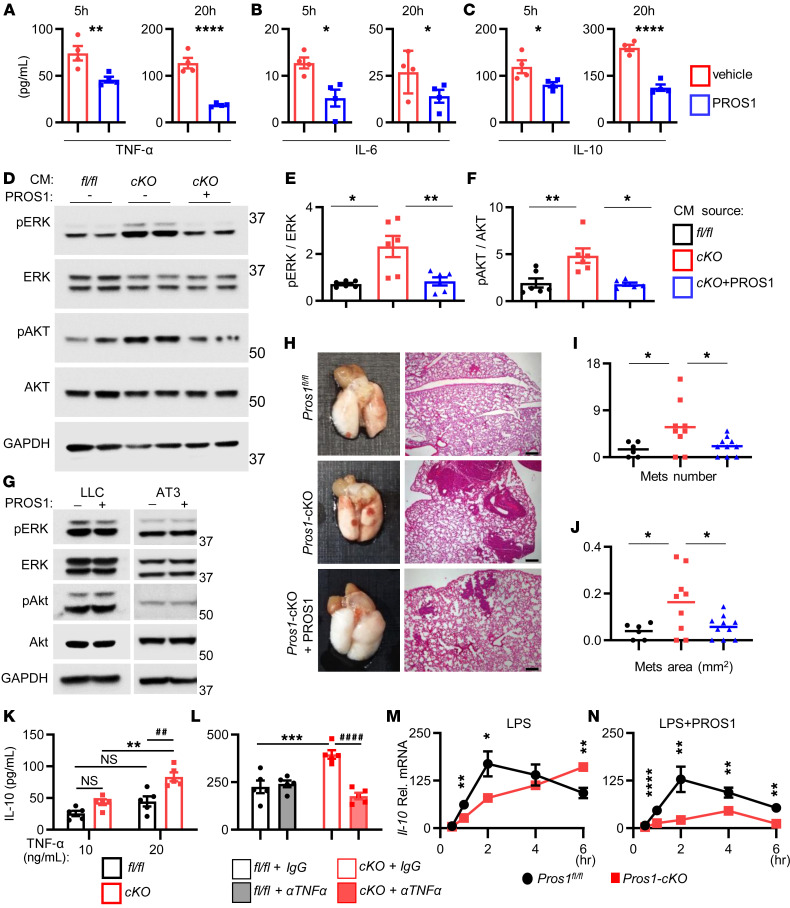
Figure 7. Exogenous PROS1 dampens the inflammatory signature of Pros1-cKO BMDMs and mitigates metastasis in vivo.
(A–C) Cytokine secretion by LPS-stimulated (100 ng/mL) tumor-naive Pros1-cKO BMDMs, incubated with vehicle or PROS1 (25 nM). ELISA measurements at 5, 20 hours. Mean ± SEM; n = 4/group. TNF-α (A, **P = 0.007; ****P = 0.0001), IL-6 (B, *P = 0.03; 0.05), IL-10 (C, *P = 0.02; ****P < 0.0001); t test. (D–F) PROS1 reverses the prometastatic potential of cKO-BMDMs. Representative Western blot (D), quantification of ERK (E; *P = 0.03; **P = 0.01), and AKT (F; *P = 0.02; **P = 0.003) activation in LLC cells educated with CM from fl/fl or cKO cells, with or without PROS1 (25 nM). Two mice of 6 are shown/group; 1-way ANOVA. (G) Western blot analysis showed no direct activation of AKT or ERK by PROS1-treated LLC cells (25 nM, 24 hours). A representative blot of 3 experiments is shown. (H–J) PROS1 suppressed the metastasis-inducing potential of cKO-BMDMs in vivo. (H) WT mice (n = 6–10/group) were inoculated with educated cells as described in D. Lungs were assessed for metastases 3 weeks later (left). H&E sections (right) were used to quantify the average metastatic area (I; *P = 0.03) and number (J; *P = 0.04); 1-way ANOVA. The horizontal line marks the mean tumor weight. Scale bars: 200 μm. (K and L) TNF-α regulates IL-10 secretion in cKO BMDMs. (K) ELISA measurements of IL-10 secretion by TNF-α–stimulated (10 and 20 ng/mL; 24 hours) control and cKO BMDMs. Mean ± SEM; n = 5 mice/group. **P = 0.0014; ##P = 0.002; NS, nonsignificant; 2-way ANOVA. (L) ELISA measurements of IL-10 secretion from LPS-stimulated (100 ng/mL; 24 hours) fl/fl or cKO pretreated with IgG or anti–TNF-α neutralizing antibody. Mean ± SEM; n = 5. ***P = 0.0006; ####P < 0.0001; 2-way ANOVA. (M and N) Relative Il-10 mRNA levels of LPS-simulated (100 ng/mL) BMDMs without (M; *P = 0.02, **P < 0.01 [=0.002 and 0.004 at 1 and 6 hours, respectively] or with PROS1 (25 nM) (N; **P ≤ 0.01, ****P < 0.0001). Relative mean ± SEM; n = 5 mice/group; Holm-Sidak multiple t test.

