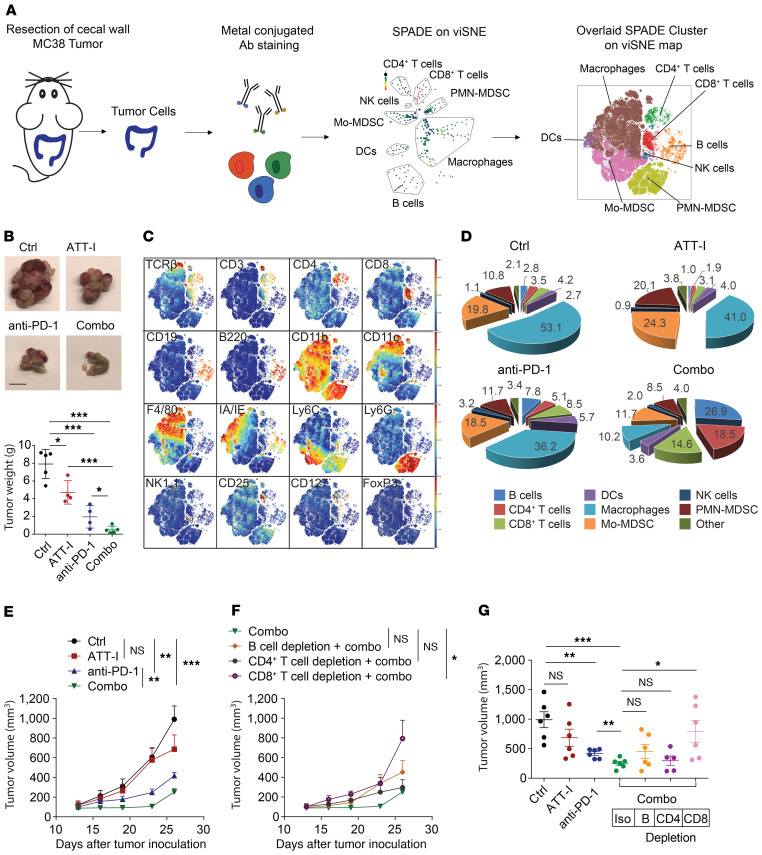
Figure 7. ATT-I enhances tumor-infiltrating lymphocytes and antitumor activity of cytotoxic T lymphocytes.
(A) Schematic illustration of the immune composition analysis using single-cell mass cytometry (CyTOF). Orthotopic MC38 tumors were surgically resected, dissociated to single cells, and stained with metal isotope–conjugated antibodies. Immune profiles were assessed via CyTOF (26 markers) and analyzed using the Cytobank platform. viSNE analysis was performed, and thereafter SPADE on viSNE was assessed for an overlaid clustering of the immune cell populations. (B) Representative MC38 tumor images and weights of cecal wall implanted tumors (n = 5 in each group). Statistical analysis was conducted using 1-way ANOVA. Scale bar: 1 cm. (C) viSNE plots of the indicated markers used for the determination of the cell population gates. (D) Percentages of distinct immune cell populations within the CD45+ infiltrating immune cells in colorectal cancer tumors analyzed with Cytobank (n = 5). (E–G) Once the subcutaneous MC38 tumors were established, mice were randomly assigned into 7 groups and treated as indicated. Effects of the ATT-I (50 mg/kg, daily) and anti–PD-1 (3 times/week, 5 injections in total) treatment on tumor growth (E and F) and tumor volume (G) upon depletion of B cells, CD4+ T cells, and CD8+ T cells (n = 6). Error bars represent SEM and statistical analysis were conducted using 2-way ANOVA (E and F) and 1-way ANOVA (G). *P < 0.05; **P < 0.01; ***P < 0.001.

