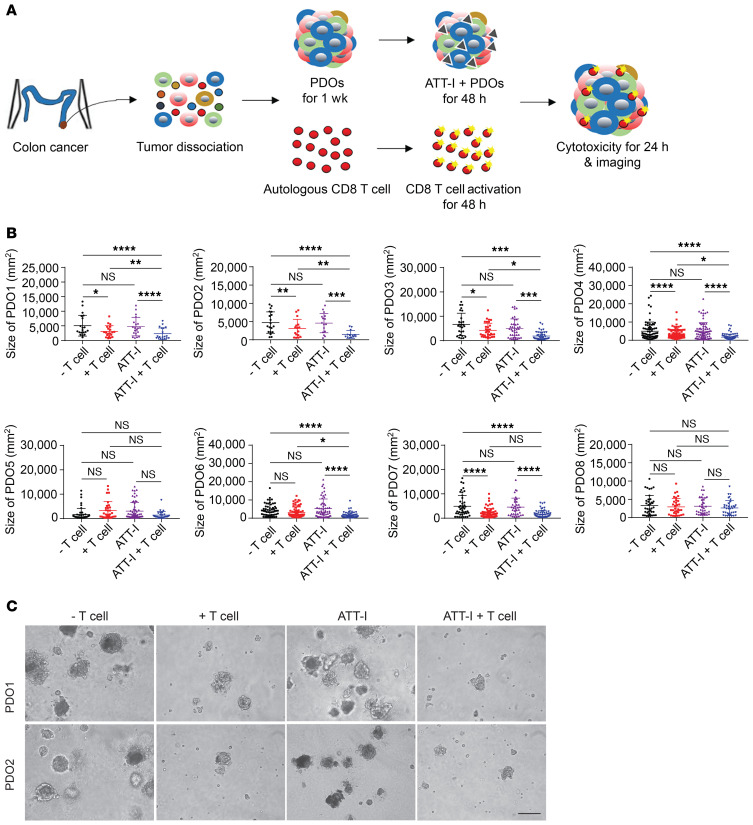
Figure 9. ATT-I enhances the autologous T cell responses in CRC patient–derived tumor organoids.
(A) Schematic representation of patient-derived organoids (PDOs) cocultured with autologous CD8+ T cells in the presence or absence of ATT-I. (B) Quantification of the organoid size presented as mean ± SD from 8 different patients (PDO1–PDO8). The size of organoids was measured as project area (μm2) using Image J software. Statistical analysis was conducted using 1-way ANOVA. (C) Microscopic images of PDOs cocultured with autologous CD8+ T cells in the presence or absence of ATT-I (30 μM) from patient 1 (PDO1) and patient 2 (PDO2). Scale bar: 100 μm. *P < 0.05; **P < 0.01; ***P < 0.001; ****P < 0.0001.

