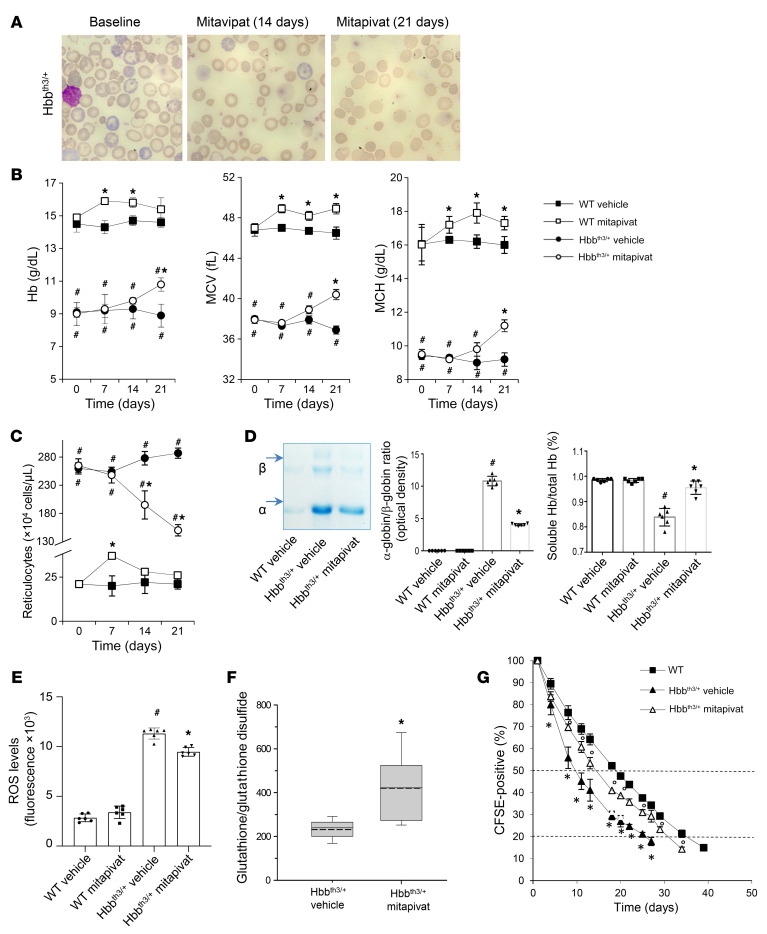
Figure 1. Mitapivat treatment improved chronic hemolytic anemia and red cell survival in the Hbbth3/+ mouse model of β-thalassemia.
WT and Hbbth3/+ mice were treated with vehicle or mitapivat 50 mg/kg twice daily. (A) Erythrocyte morphology. One representative image from 8 with similar results shown. Original magnification ×100. (B and C) Hb, MCV, MCH, and reticulocyte count in WT and Hbbth3/+ mice treated with vehicle or mitapivat. Data are mean ± SD (n = 6). (D, left panel) Triton acid-urea gel electrophoresis of red cell membrane from WT and Hbbth3/+ mice treated with vehicle or mitapivat (21 days). Arrows show α-globin and β-globin associated with red cell membrane. (D, middle panel) Gel quantification expressed as α-globin/β-globin ratio to Hb. Data are mean ± SD (n = 6). (D, right panel) Total and soluble Hb (Drabkin’s method) in hemolysates from Hbbth3/+ mice treated with vehicle or mitapivat (21 days). Data are mean ± SD (n = 6). (E) ROS levels in red cells from WT and Hbbth3/+ mice treated with vehicle or mitapivat. Data are mean ± SD (n = 6 each). (F) Difference in the glutathione/glutathione disulfide ratio between Hbbth3/+ mice treated with vehicle or mitapivat (n = 5–9 for each). Boxes represent 25th to 75th percentiles; continuous and dashed lines mark median and mean values, respectively. Whiskers indicate 90th and 10th percentiles. *P < 0.05 by 2-tailed t test. (G) Survival of CFSE-labeled red cells from WT (n = 4) and Hbbth3/+ mice treated with vehicle or mitapivat (n = 3 each group). Data are mean ± SD. (B, C, and G) #P < 0.05 compared with WT and *P < 0.05 compared with vehicle by 1-way ANOVA with Dunnett’s longitudinal comparison test. (D and E) #P < 0.02 compared with WT and *P < 0.05 compared with vehicle-treated mice.

