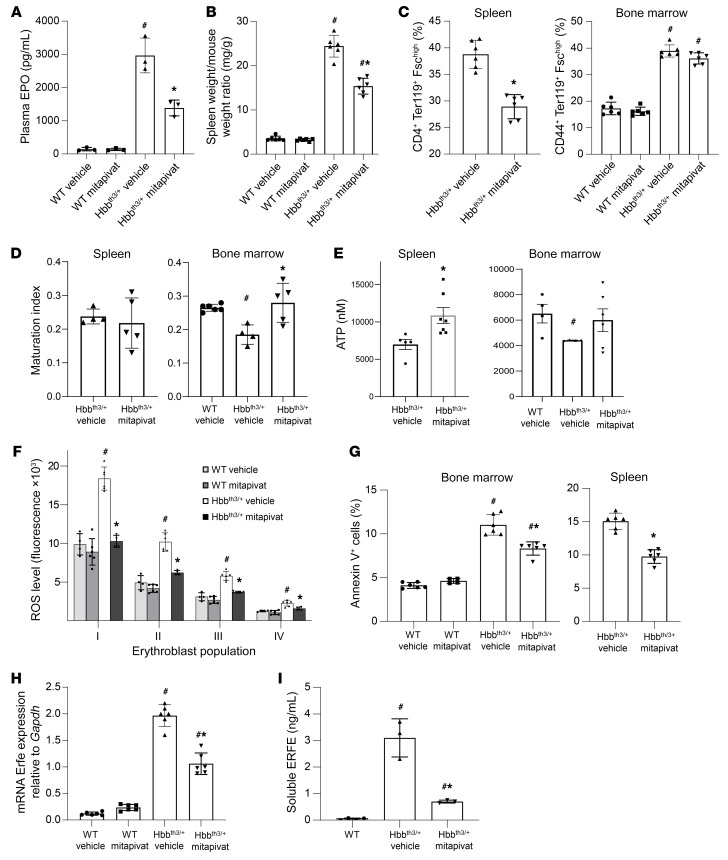
Figure 2. Mitapivat ameliorated ineffective erythropoiesis in Hbbth3/+ mice.
(A) Plasma EPO in WT and Hbbth3/+ mice. Data are mean ± SD (n = 3). (B) Spleen weight/mouse weight ratio in WT and Hbbth3/+ mice. Mean ± SD (n = 6). (C) Flow cytometry (CD44-Ter119 and cell size markers) of bone marrow and spleen from WT and Hbbth3/+ mice. Mean ± SD (n = 6). (D) Ratio of proerythroblasts plus basophilic erythroblasts/polychromatic plus orthochromatic erythroblasts (maturation index) in spleen and bone marrow from Hbbth3/+ mice by flow cytometry. Mean ± SD (Hbbth3/+, n = 4 vehicle-treated, n = 5 mitapivat-treated; WT, n = 6). (E) ATP content in sorted CD44-Ter119 total erythroblasts from spleen and bone marrow of Hbbth3/+ mice and bone marrow of WT mice. Mean ± SEM (spleen, vehicle-treated, n = 5, versus mitapivat-treated, n = 7; P < 0.05; bone marrow, WT vehicle, n = 4, Hbbth3/+ vehicle-treated, n = 4, versus mitapivat-treated, n = 6; P = NS). (F) ROS levels in erythroblasts from WT or Hbbth3/+ mice. Mean ± SD (WT, n = 4 vehicle-treated and n = 6 mitapivat-treated; Hbbth3/+, n = 6 vehicle and n = 4 mitapivat-treated). (G) Annexin-V+ erythroid cells from WT or Hbbth3/+ mice. Mean ± SD (WT, vehicle-treated n = 6 and mitapivat-treated n = 4; Hbbth3/+, n = 6 each group). (H) mRNA expression of Erfe by qRT-PCR of sorted erythroblasts from bone marrow of WT and Hbbth3/+ mice. Mean ± SD, n = 6. (I) Soluble plasma ERFE levels in WT and Hbbth3/+. Mean ± SD (WT, vehicle-treated n = 4; Hbbth3/+, n = 3 each group). (A–D, F–I) #P < 0.05 versus WT mice and *P < 0.05 versus vehicle-treated mice by 2-way ANOVA with Bonferroni multiple comparison correction.

