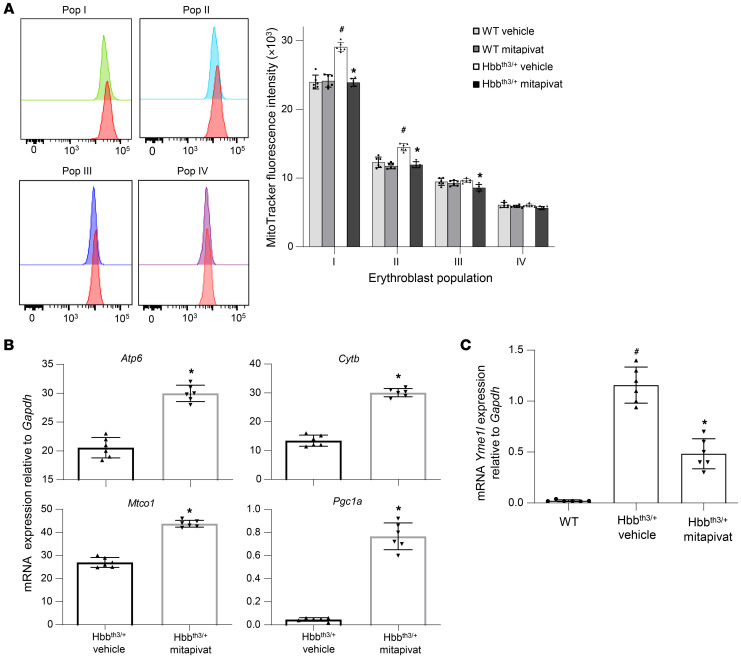
Figure 3. Mitapivat improved mitochondrial dysfunction and biogenesis in Hbbth3/+ mice.
(A, left panel) Flow cytometric analysis using MitoTracker in erythroblasts from WT (red) and Hbbth3/+ (proerythroblasts [pop I, green], basophilic erythroblasts [pop II, blue], polychromatic erythroblasts [pop III, purple], and orthochromatic erythroblasts [pop IV, pink]) mice. One representative scatter from 4 with similar results is presented. (A, right panel) Mitochondrial content of erythroblasts from WT and Hbbth3/+ mice treated with vehicle or mitapivat. Data are mean ± SD (n = 6). (B) mRNA expression of Atp6, Mtco1, Cytb, and Pgc1a genes by qRT-PCR on sorted erythroblasts from bone marrow of Hbbth3/+ mice treated with vehicle or mitapivat. Data are mean ± SD (n = 6 per group). (C) mRNA expression of Yme1l by qRT-PCR on sorted erythroblasts from bone marrow of WT and Hbbth3/+ mice treated with vehicle or mitapivat. Data are mean ± SD (n = 6 per group). (A–C) #P < 0.05 compared with WT mice and *P < 0.05 compared with vehicle-treated mice by 2-way ANOVA with Bonferroni multiple comparison correction.

