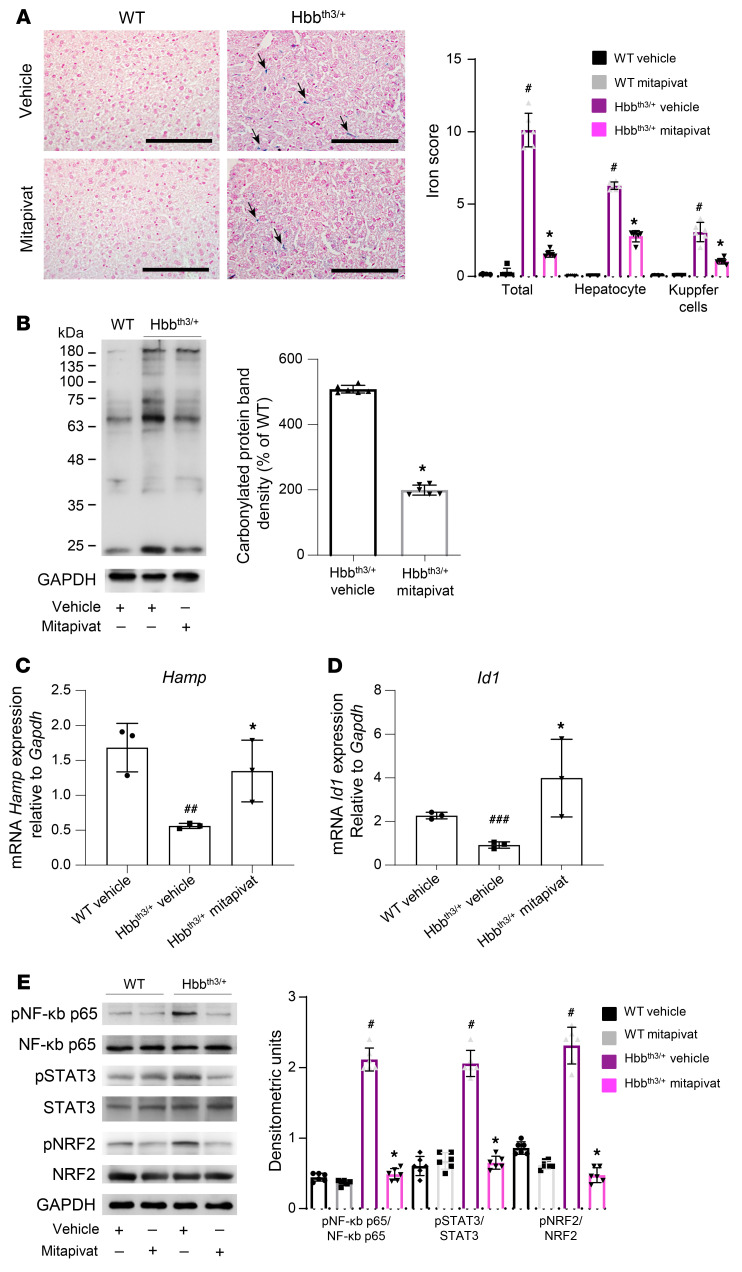
Figure 4. In Hbbth3/+ mice, mitapivat reduced liver iron overload and oxidative stress and increased hepcidin.
(A, left panel) Iron staining (Perl’s Prussian blue) in liver from WT and Hbbth3/+ mice treated with vehicle or mitapivat. Original magnification ×200. Scale bars: 100 μM. One representative image from 4 with similar results. Black arrows indicate liver iron deposits. (A, right panel) Quantification of iron staining in liver. Data are mean ± SD (n = 6). #P < 0.05 compared with WT mice and *P < 0.05 compared with vehicle-treated mice by 2-way ANOVA with Bonferroni multiple comparison correction. (B) Soluble fractions of liver from WT and Hbbth3/+ mice with and without mitapivat were analyzed with 12% SDS-PAGE and OxyBlot. Quantification of band area was performed by densitometry and expressed as a percentage of WT. Data are mean ± SD, n = 6. (C and D) mRNA expression of hepcidin (Hamp) and Id1 by qRT-PCR on liver from WT and Hbbth3/+ mice treated with vehicle or mitapivat. Experiments were performed in triplicate. Data are mean ± SD. #P < 0.05 compared with WT mice and *P < 0.05 compared with vehicle-treated mice by multiple comparisons using ANOVA; internal comparisons were calculated by unpaired 2-tailed Student t test. ##P < 0.05 compared with WT mice, ###P < 0.02 compared with WT mice, *P < 0.05 compared with HBBth3/+ mice. A 2-sided P < 0.05 was considered statistically significant. (E, left panel) Western blot analysis with specific antibodies against phospho (p) NF-κB p65, NF-κB p65, pSTAT3, STAT3, pNRF2, and NRF2 of liver from WT and Hbbth3/+ mice with vehicle or mitapivat treatment, GAPDH as loading control. One representative gel from 6 with similar results. (E, right panel) Densitometric analyses of the Western blots. Data are mean ± SD (n = 6). (B and E) #P < 0.05 compared with WT mice and *P < 0.05 compared with vehicle-treated mice by 2-way ANOVA with Bonferroni multiple comparison correction.

