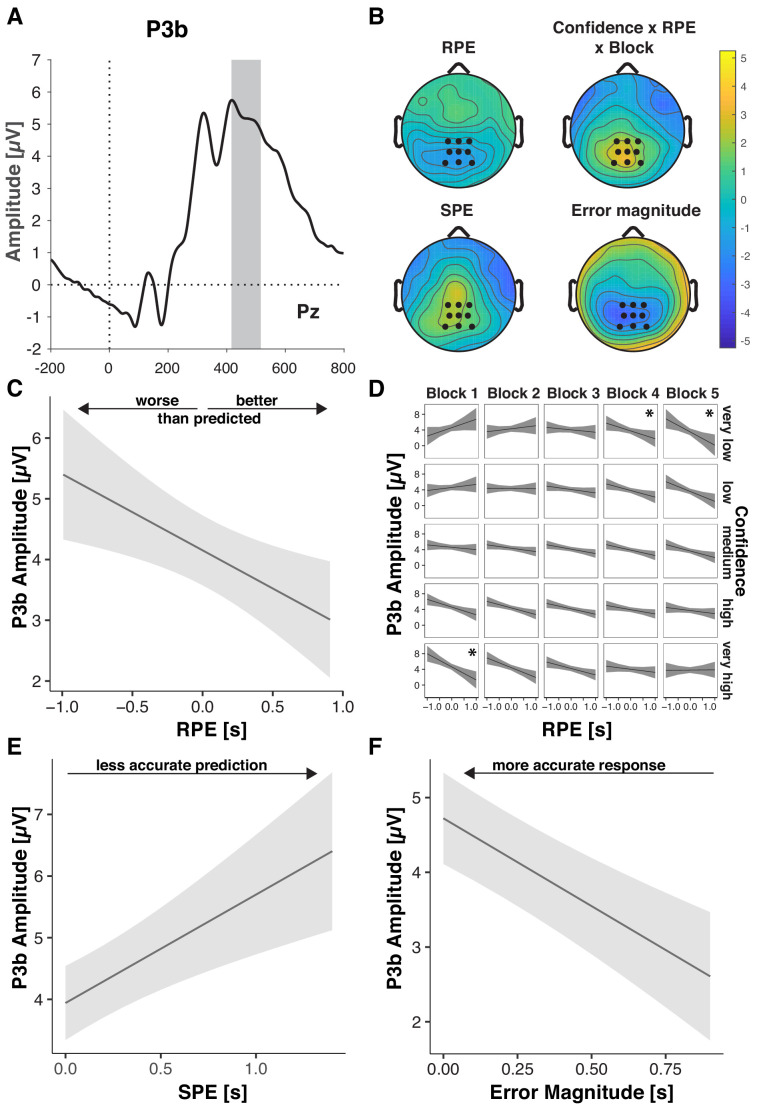
Figure 5. Performance-relevant information converges in the P3b.
(A) Grand average ERP waveform at Pz with the time window for quantification, 416–516 ms, highlighted. (B) Effect topographies as predicted by LMMs for RPE, error magnitude, SPE and the RPE by Confidence by Block interaction. (C–F) LMM-estimated effects on P3b amplitude visualized with the effects package in R; shaded areas represent 95% confidence intervals. (C.) RPE. Note the interaction effects with Block and Confidence (D), that modulate the main effect (D) Three-way interaction of RPE, Confidence and Block. Asterisks denote significant RPE slopes within cells. (E) P3b amplitude as a function of SPE. (F) P3b amplitude as a function of Error Magnitude.
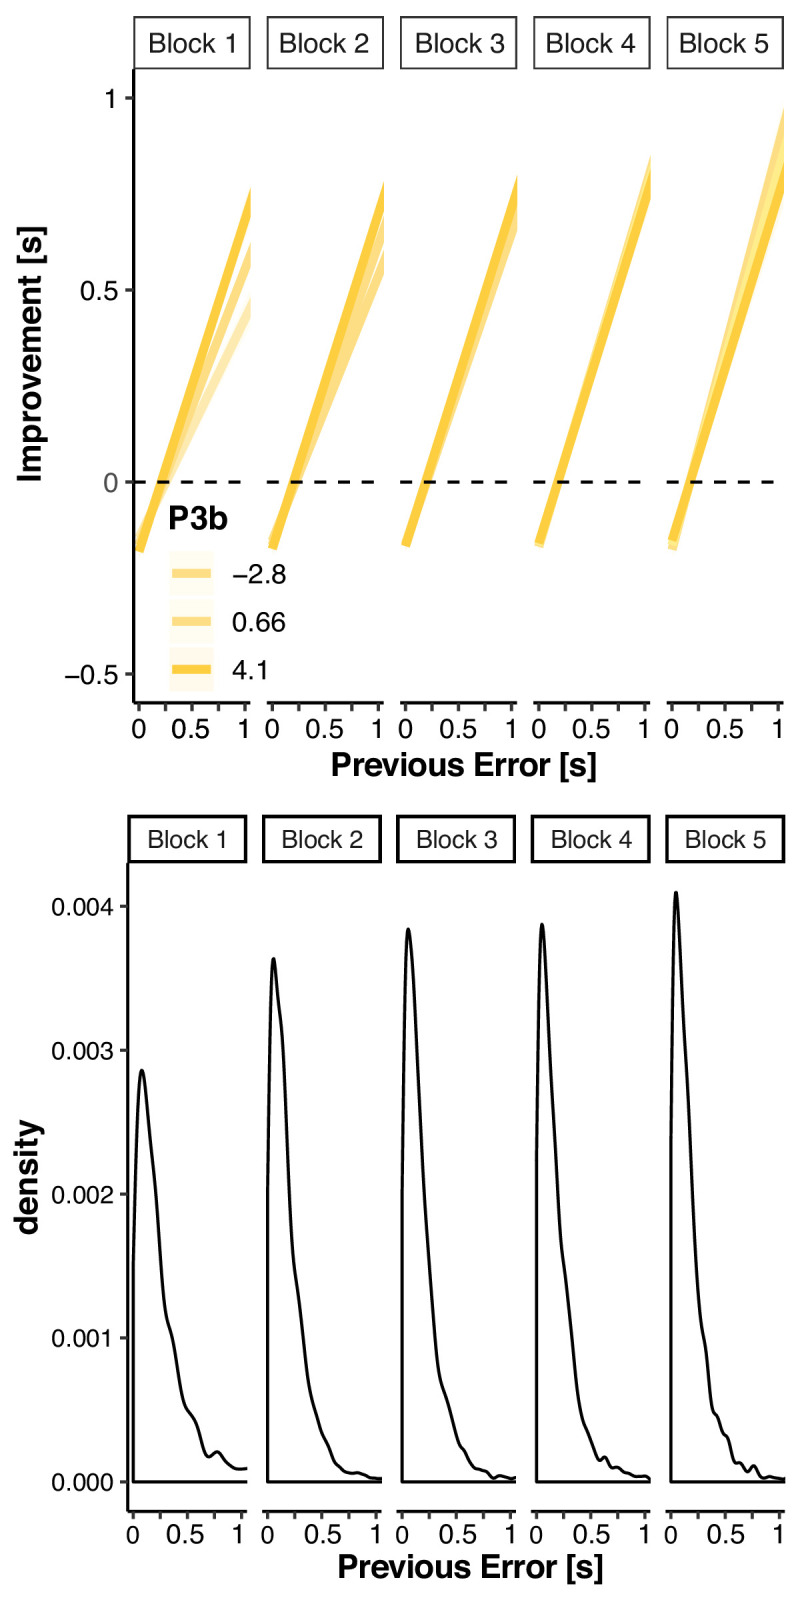
Figure 5—figure supplement 1. P3b to feedback modulates error-related adjustments on the subsequent trial.


