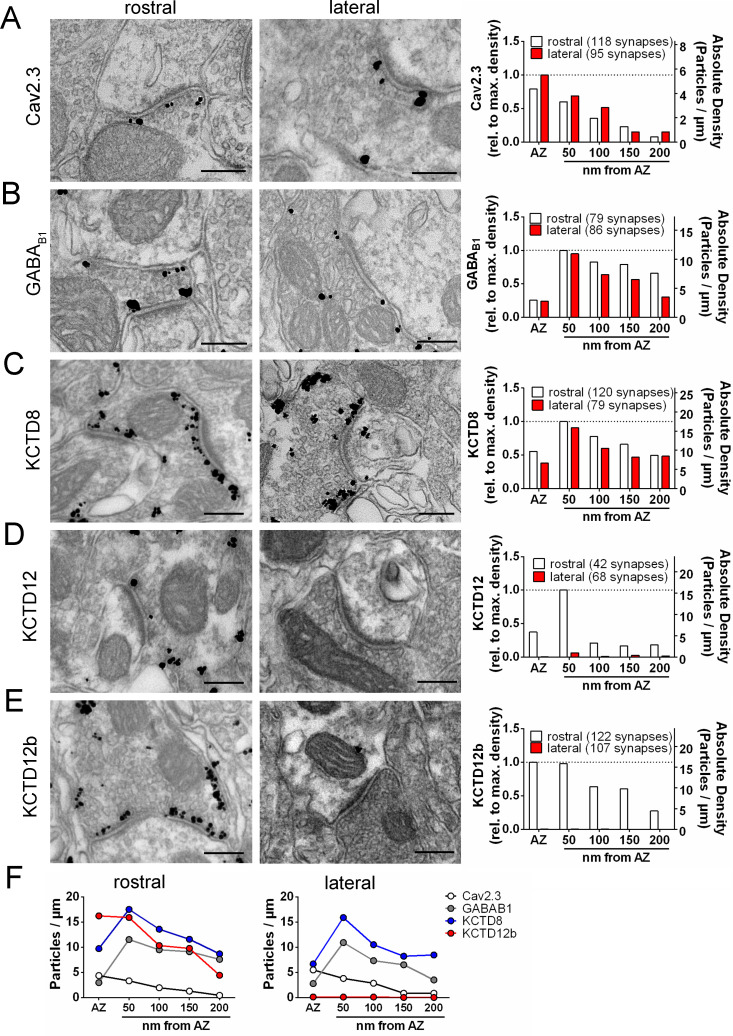
Figure 3. Quantification of the presynaptic localization of Cav2.3, GBRs, and KCTDs along the ventral and dorsal MHb-IPN pathways.
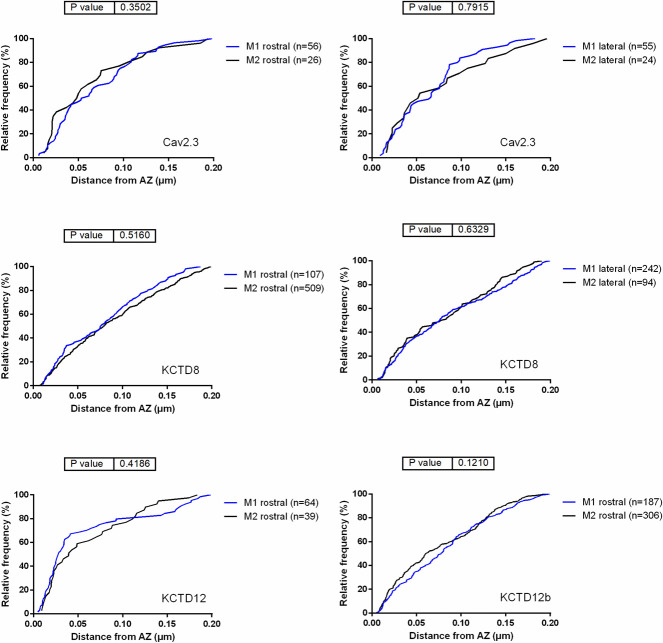
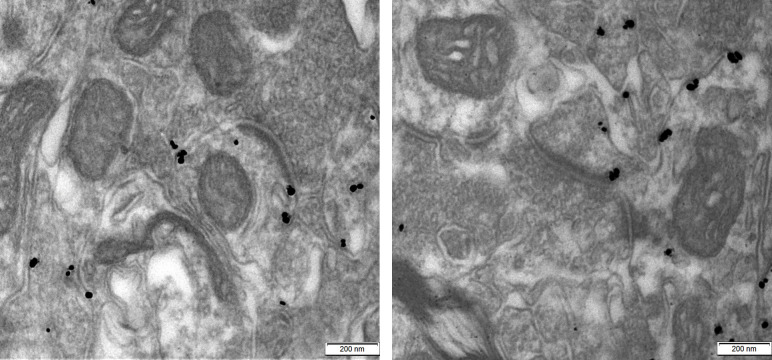
Transmission electron microscopy images of 70 nm thick sections following pre-embedding immunolabeled IPN slices for Cav2.3 (A), GABAB1 (B), KCTD8 (C), KCTD12 (D), and KCTD12b (E) from synapses in the rostral (left images) and lateral (right image) IPN subnuclei. Scale bars: 200 nm. Graph on the right displays quantification of relative and absolute silver-enhanced gold particle densities in the active zone and at distances of 50–200 nm from the edge of the active zone (50 nm bins). (F) Absolute labeling densities are summarized for synapses in the rostral (left) and lateral IPN (right). Note the absence of KCTD12 and KCTD12b particles in presynaptic terminals inside the lateral IPN subnuclei. KCTD12 was not included in panel F because of predominantly postsynaptic localization inside the rostral IPN. Data was pooled from two animals, showing no significant difference in gold particle distribution patterns with Kolmogorov-Smirnov test (see Figure 3—figure supplement 1 and Figure 3—figure supplement 2).


