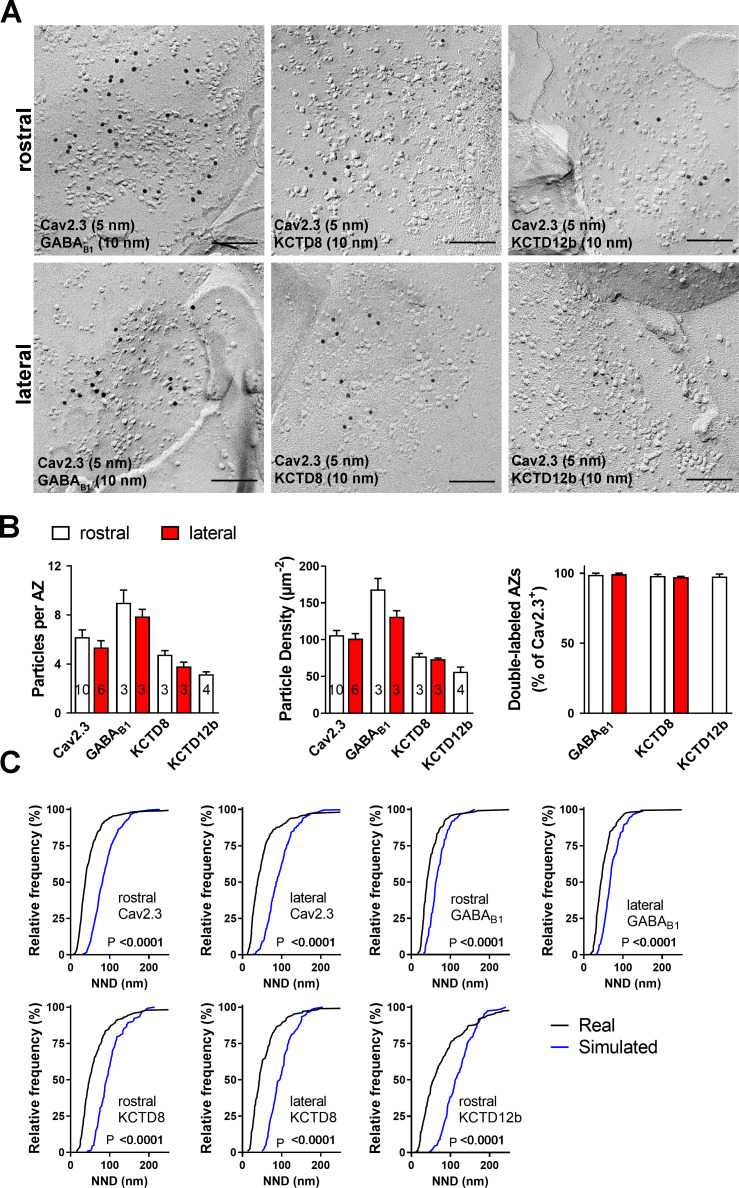
Figure 5. Co-localization of Cav2.3 with GBR and KCTDs in the active zone of medial habenula terminals.
(A) Active zones double labeled for Cav2.3 and either GABAB1 (left), KCTD8 (middle), or KCTD12b (right) in IPN replicas. Top row images are from presynaptic terminals in the rostral IPN; bottom row images are from presynaptic terminals in the lateral IPN. Scale bar: 100 nm. (B) Quantification of active zone immunolabeling in the rostral and lateral IPN. With the exception of the absence of KCTD12b in lateral IPN terminals, absolute particle numbers per active zone (left graph) and particle densities (middle graph) are comparable between MHb terminals in the rostral and lateral IPN. Right graph: Over 97% of active zones positive for Cav2.3 labeling also show labeling for one of the other molecules (GABAB1, KCTD8, or KCTD12b), suggesting co-localization of all presynaptic molecules inside the same active zone. Numbers inside the bars indicate the number of replicas used for each quantification. (C) Nearest-neighbor distance (NND) for all presynaptic molecules in MHb terminals inside the rostral and lateral IPN based on the real (black line) and simulated random distribution (blue line). Smaller NND values in real distributions compared to simulation suggest clustering of all presynaptic molecules. p-values calculated via Kolmogorov–Smirnov test.

