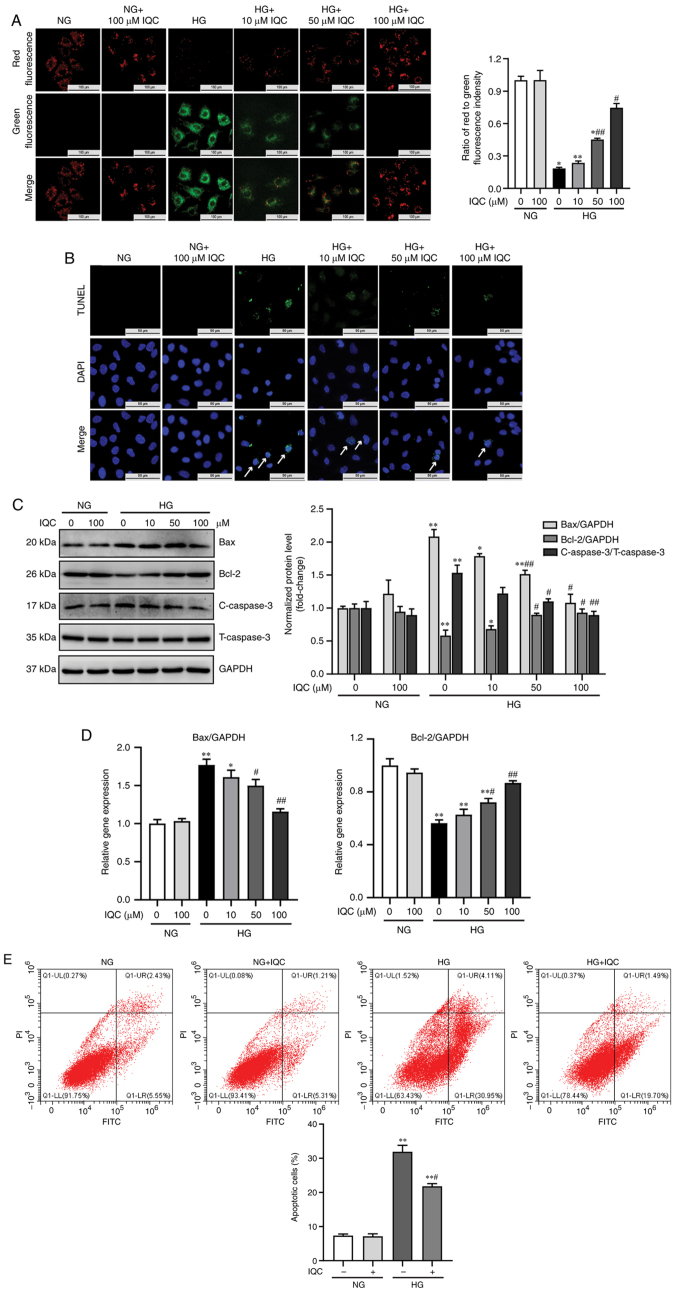
Figure 2.
IQC attenuates the HG-induced apoptosis of HUVECs. (A) Representative images of JC-1 staining were used to observe the change in mitochondrial membrane potential in the indicated groups, and the ratio of red fluorescence to green fluorescence was quantified. Scale bar, 100 µm. (B) TUNEL assay was used to assess apoptosis levels by fluorescence microscopy in different groups. TUNEL positive cells (green); nucleus/DAPI (blue). Arrows indicate apoptotic cells. Scale bar, 50 µm. (C) Representative western blotting images of Bax, Bcl-2, C-caspase3, T-caspase3 and GAPDH protein bands and their quantification in the indicated groups (n=3). GAPDH was used as a control. (D) Relative mRNA expression levels of Bax and Bcl-2 in HUVECs in each group with different treatments (n=6). GAPDH was used as a control. (E) Representative dot plots of the apoptosis rate as measured by flow cytometry after AnnexinV-FITC/PI staining and quantitative data of the percentage of apoptotic cells (n=3). *P<0.05 and **P<0.01 vs. NG. #P<0.05 and ##P<0.01 vs. HG. NG, normal glucose; HG, high glucose; IQC, isoquercitrin; HUVECs, human umbilical vein endothelial cells; C/T-caspase 3, cleaved/total caspase 3.

