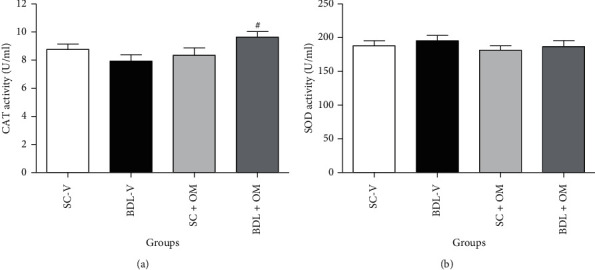
Figure 5.

Effect of OM on CAT (a), SOD (b) activity in the liver tissue. Each value represents the mean ± SEM. SC-V, sham control + vehicle; BDL-V, bile duct-ligation + vehicle; OM, Origanum majorana; CAT, catalase; SOD, superoxide dismutase. #Significantly different from BDL-V group, P ≤ 0.05.
