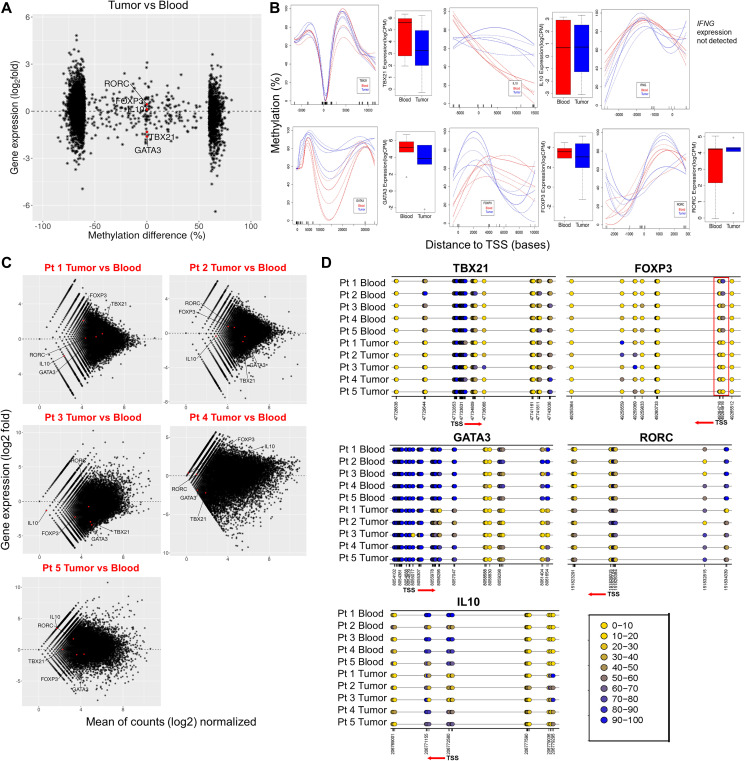
Figure 3. Methylation signature and gene expression alterations of CD4+ lineage specific genes in tumor CD4+ T cells vs blood.
(A) Methylation difference (%) around promotor regions (horizontal axis) plotted against expression of the corresponding genes (vertical axis; log2 values from RNA-seq) in CD4+ T cells. Select CD4+ T cell lineage genes including TBX21 (Th1), GATA3 (Th2), RORC (Th17), iTreg (FOXP3) and IL10 are marked as red dots. (B) Methylation profiles across select genes presented as methylation difference (%, vertical axis). Horizontal axes denote distance from the TSS in bases. On the right side of each methylation plot, the presented boxplots represent the expression (log CPM values from RNA-seq analysis) of the corresponding genes in blood (red) and tumor (blue) CD4+ T cells. (C) Transcript profiles of individual tumor CD4+ T cell samples normalized to all blood samples combined is shown. Vertical axis represents gene expression as log2 fold. The red labels inside the plot represents each tumor sample names compared to blood. Each red dot inside the plots represent the select genes of CD4+ T cell lineage included for the analysis. Genes above and below the horizontal line (marked as 0 in the center of the plots) represents up and downregulated genes, respectively. (D) Detailed methylation differences in the CpG islands within selected lineage specific genes and their TSS are presented as color coded rings (yellow (0) being hypomethylated and blue (100) being hypermethylated). Below each plot, the numbers indicate genomic position of individual CpG sites. The red arrow and its direction indicate TSS and the direction of transcription of the gene.

