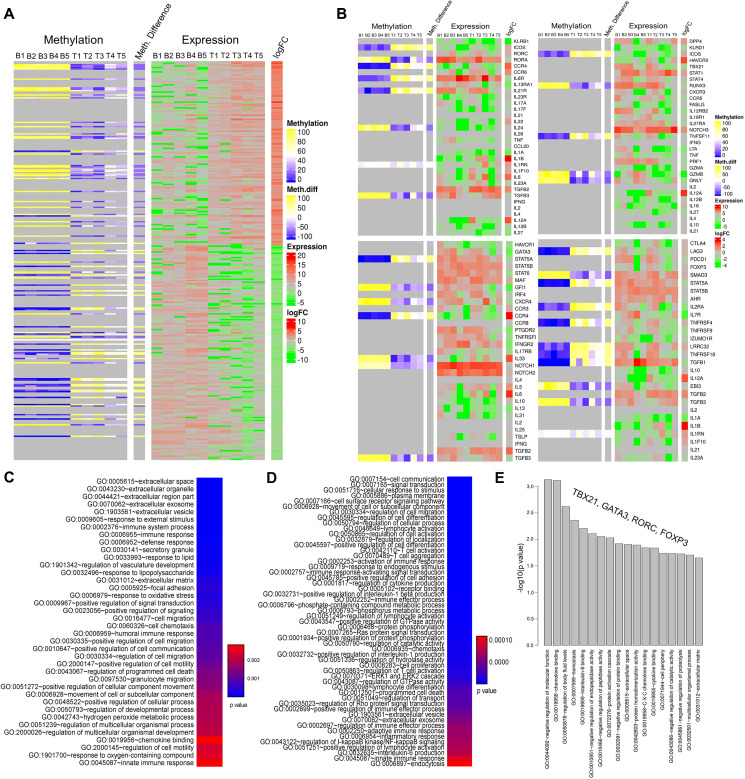
Figure 4. Epigenetic landscape of tumor infiltrating CD4+ T cells: focus on genes related to specific subpopulations.
(A) Heatmap showing methylation status and expression profiles of the corresponding genes in individual patient’s blood (5 samples on the left-hand side) and tumor CD4+ T cells (5 samples on the right-hand side). The labels on top of the heatmap represents DNA methylation (left) and RNA expression (right) levels. In the methylation data, yellow bands indicate hyper and blue represents hypomethylation. Similarly, green is for down and red for upregulated genes in the expression data. (B) Heatmap showing methylation difference and the gene expression level of set of genes corresponding to four predominant CD4+ T-cell lineage: Th17 cells (top left panel), Th1 (top right panel), Th2 (bottom left panel) and iTreg (bottom right panel). The color codes are same as described for panel A. (C–E) represents top biological pathways obtained from gene ontology analysis using genes associated with the DMRs, dysregulated genes from RNA-seq analysis and gene set comprising specific CD4+ T cells, respectively. Color keys in panels C and D represent p values where blue being the lowest p value.

