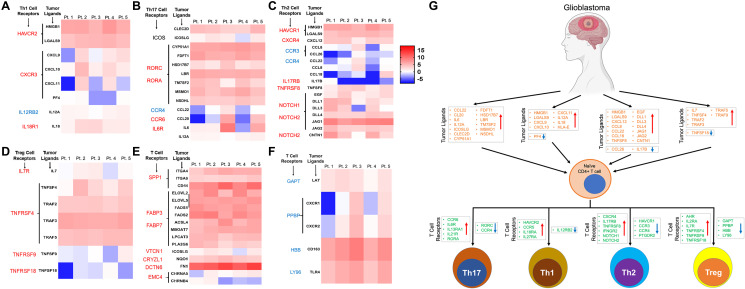
Figure 5. Expression pattern of ligands of corresponding receptors specific for CD4+ T cell lineages in GBM tumor tissue.
(A–D) The heatmaps show expression of the ligands in tumor tissue and graphical representation of their corresponding receptor expression level on the CD4+ T-cells in the four major subtypes: Th1 (panel A), Th17 (panel B), Th2 (panel C) and iTreg (Panel D) CD4+ T cells in GBM tumors. Font colors (red; upregulated and blue; downregulated) of the receptors on the left to the heatmap represent expression pattern. The heatmap color keys indicate up (red) and down (blue) regulation of a gene. Expression of genes only in tumor CD4+ T cells are shown. Each patient is labelled as Pt followed by a number (on top of the heatmap). (E and F) represents top up and down regulated, respectively, ligands or receptors in CD4+ T cells from tumors. The color keys of the heatmap is similar to one described earlier for panels A–D. (G) Graphical representation of our findings. GBM differentially expresses various immune modulating ligands (up and down regulation showed as up and down arrows) which in turn bind to specific receptors on undifferentiated naïve CD4+ T cells. This results in modulation of the signaling pathways leading to the lineage specific Th1, Th17, Th2, and iTreg cells. All the dysregulated ligands and receptors were combined in this graphical abstract to show their expression patterns in respective tumor infiltrating CD4+ T cell lineages. Orange color genes are ligands and one in blue are their receptors. Direction of the arrows in the box indicates expression level of the genes (upward arrow; upregulated and vice versa).

