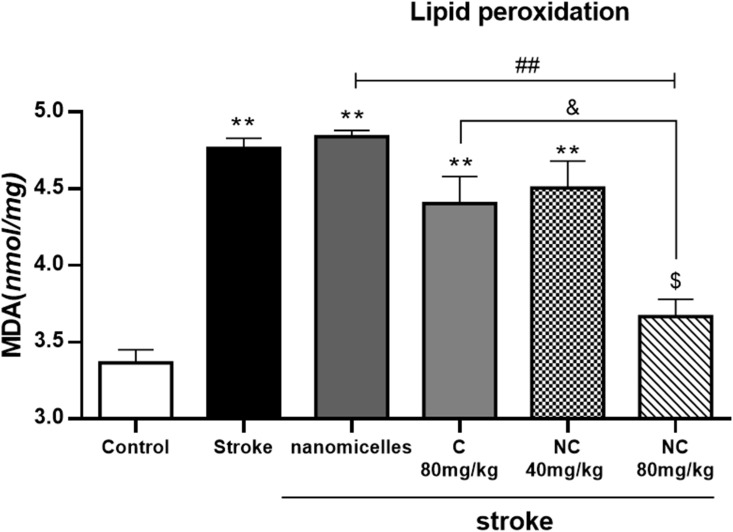
Figure 5.
Malondialdehyde (MDA) production in cerebral ischemia rats treated with NC and C (n = 6). **p <0. 01 = significant difference compared with the control group; ##p <0. 01 = significant difference compared with stroke group; &p <0. 05 = significant difference between the pretreatment groups with 80mg/kg NC compared with 80 mg/kg C;. $p <0. 05 = significant differences between the pre-treatment groups with 80mg/kg NC compared to the group receiving 40mg/kg NC (n=6).

