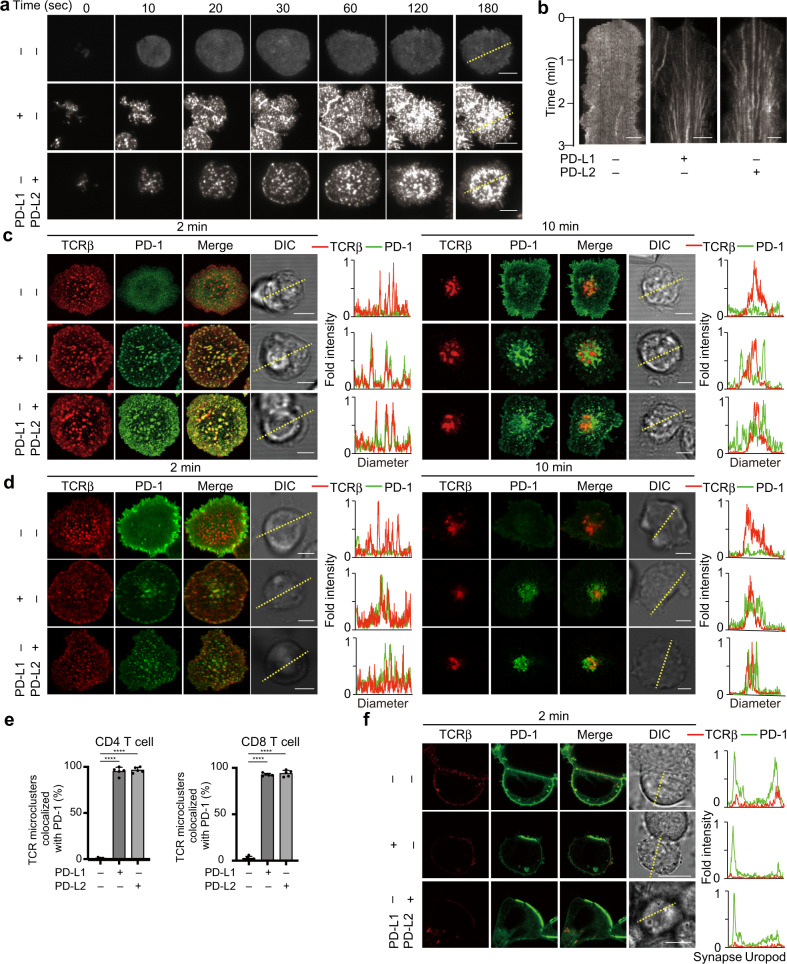
Fig. 1. Translocation of PD-1 at TCR microclusters introduced by PD-1–PD-L1 or PD-1–PD-L2 binding.
a CD4+ T cells were purified from AND-Tg Pdcd1−/− Rag2−/− mice, stimulated with irradiated B10.BR whole splenocytes with 5 μM MCC88–103 peptides, and retrovirally transduced with mouse (m) PD-1–EGFP. The cells were plated onto an MCC88–103-prepulsed SLB containing I-Ek–GPI (200/μm2) and mICAM-1–GPI (100/μm2) without (top) or with mouse mPD-L1–GPI (middle, 150/μm2) or mPD-L2–GPI (bottom, 150/μm2) and real-time imaged by total internal reflection fluorescence microscopy (times are above images; Supplementary Movie 1). b Clustering and centripetal movement of PD-1 on the diagonal yellow line in a is presented as horizontal elements in kymographs. c Primary CD4+ T cells expressing mPD-1–EGFP (green) in a were prestained with DyLight 650-labeled anti-TCRβ (H57) Fab (red), plated onto an SLB as in a and real-time imaged by confocal microscopy at 2 (left) or 10 (right) min after contact. Histograms show fold fluorescent intensities of TCRβ (red) and mPD-1 (green) on the diagonal yellow lines in the DIC images. d CD8+ T cells were purified from OT-I-Tg Rag2−/− mice, stimulated with irradiated C57BL/6 whole splenocytes with 100 nM OVA257–264 peptide and retrovirally transduced with PD-1–EGFP. The cells were imaged as in a on an SLB containing OVA257–264-prepulsed H2-Kb–GPI (200/μm2). Histograms are depicted as in c. e The graph shows the percentage of TCR microclusters colocalized with mPD-1 at 2 min after contact in CD4+ T cells in c (left) and CD8+ T cells in d (right) (n = 5). f AND-TCR T cell hybridomas (2D12) expressing mPD-1–EGFP were prestained with DyLight 650-labeled H57 Fab (red), conjugated with an MCC88–103 prepulsed (5 μM) I-Ek-expressing APC line, DC-1 cell, not expressing (top) or expressing mPD-L1 (middle) or mPD-L2 (bottom) and real-time imaged by confocal microscopy at 2 min after contact. Histograms show fold fluorescent intensities of TCRβ (red) and mPD-1 (green) on the diagonal yellow lines in the DIC images. All data are representatives of three independent experiments. Bars, 5 μm. Error bars, SD. Statistical analysis was by one-way analysis of variance (ANOVA). ****p < 0.0001.

