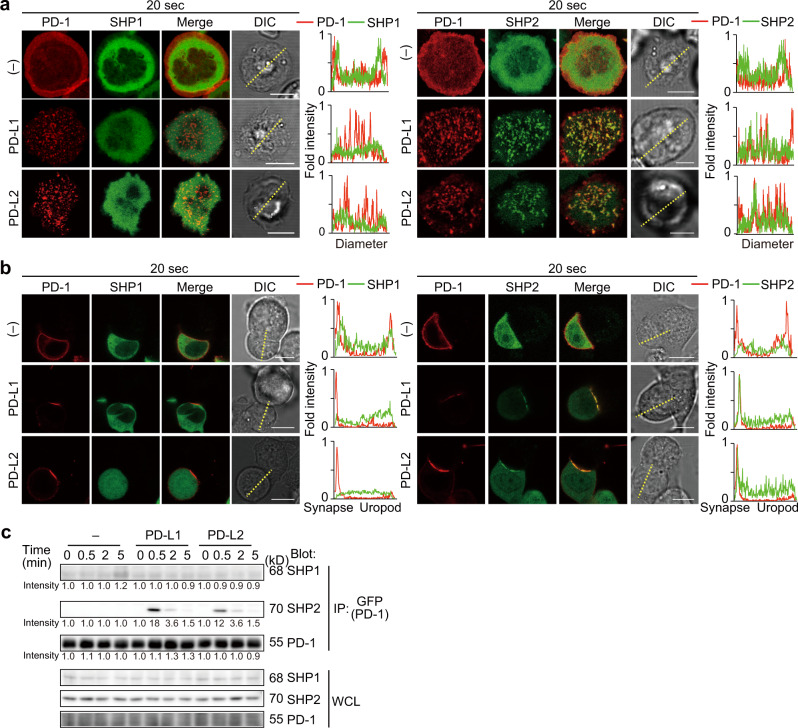
Fig. 3. SHP2, but not SHP1, is rapidly and transiently recruited to PD-1 microclusters.
a 2D12 transduced with both mPD-1–HaloTag and EGFP–SHP1 (left) or EGFP–SHP2 (right) were preincubated with the HaloTag ligand–Stella650 (red), plated onto the SLB as in Fig. 1a without (top) or with mPD-L1–GPI (150/μm2, middle) or mPD-L2–GPI (150/μm2, bottom) and real-time imaged by confocal microscopy at 20 s after contact. Histograms show fold fluorescent intensities of mPD-1 (red) and SHP1 (green) or SHP2 (green) on the diagonal yellow lines in the DIC images. b The cells in a (SHP1, left panel; SHP2, right panel) were conjugated with DC-1 cells not expressing (top) or expressing mPD-L1 (middle) or mPD-L2 (bottom) and real-time imaged by confocal microscopy at 20 s after contact. Histograms show fold fluorescent intensities of PD-1(red) and SHP1 (green, left panel) or SHP2 (green, right panel) on the diagonal yellow lines in the DIC images. c 2D12 expressing mPD-1–EGFP were conjugated by MCC88–103-prepulsed (5 μM) DC-1 cells (left) or DC-1 expressing mPD-L1 (middle) or mPD-L2 (right) for the indicated times. The cells were lysed, immunoprecipitated for PD-1 by anti-GFP and blotted for SHP1, SHP2, or PD-1. The whole cell lysates (WCLs) were blotted for SHP1, SHP2, or PD-1. The number below each line represents the intensity of the band. All data are representatives of three independent experiments. Bars, 5 μm.

