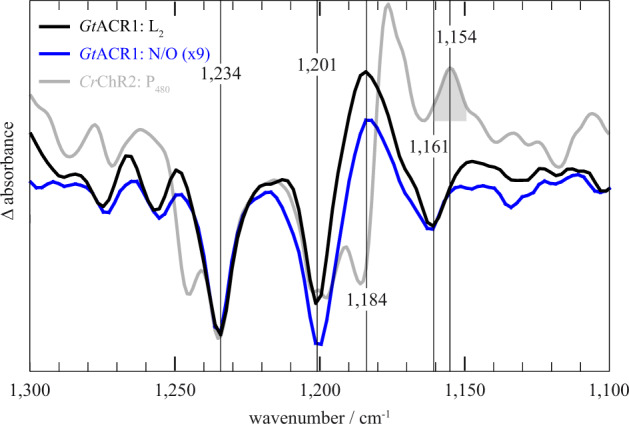
Fig. 3. Differences in the retinal absorption bands between GtACR1 and CrChR2.

GtACR1 intermediate-minus-ground state difference spectra (L2 in black, N/O in blue) compared to the P480 difference spectrum of CrChR2 (gray) based on previously published data15. GtACR1 does not display a P480 intermediate; thus, the CrChR2 P480 spectrum is compared to the spectrum of a conducting state (L2) and the late non-conducting N/O state. Spectra were scaled to the 1234 cm−1 band. The N/O spectrum had to be amplified as indicated due to its low amplitude. The gray highlighted syn-band at 1154 cm−1 of CrChR2 is not present in GtACR1, indicating that GtACR1 does not undergo a syn-cycle in contrast to CrChR2. The source data for this Fig. is given in Supplementary Data 1.
