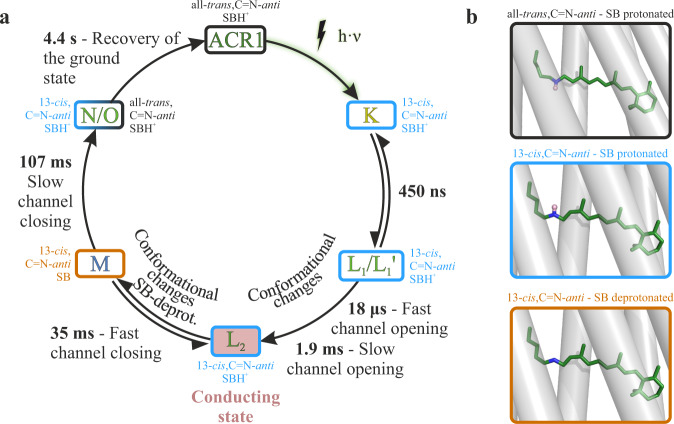
Fig. 4. Revised photocycle model of GtACR1.
a The extended photocycle model is based on our ambient temperature time-resolved FTIR-spectroscopic data (Fig. 2) along with our UV/VIS spectroscopic data (Supplementary Fig. 4) and previously published electrophysiological measurements32. The K to L transition precedes channel opening indicating a non-conducting L1 state. Channel opening occurs in a two-step process with a fast (18 µs) and a slow (1.9 ms) opening process to the conducting state L2 (red). Therefore, L1 was subdivided into L1 and L1’. The possible kinetic correlations of L1 and L2 are detailed in Supporting Fig. 5. Mechanistically, channel closing occurs exclusively upon M formation. However, the photocurrent fully disappears only upon M decay, resulting in a fast and a slow observed channel closing due to the reversible reaction between M and L2. Next, GtACR1 slowly relaxes into the ground state from the N/O intermediate state. b Different retinal states during the photocycle. All-trans,C=N-anti-structure (black box) is taken from chain A of the X-ray structure of PDB-ID 6EDQ27 and protonated according to our measurement. Structures in the blue and orange boxes are obtained by energy minimization of the retinal conformations with a restraint on the 13-cis,C=N-anti-conformation. These structures indicate the 13-cis,C=N-anti-retinal conformation with protonated and deprotonated Schiff base observed by our measurements. No C=N-anti-species is present.

