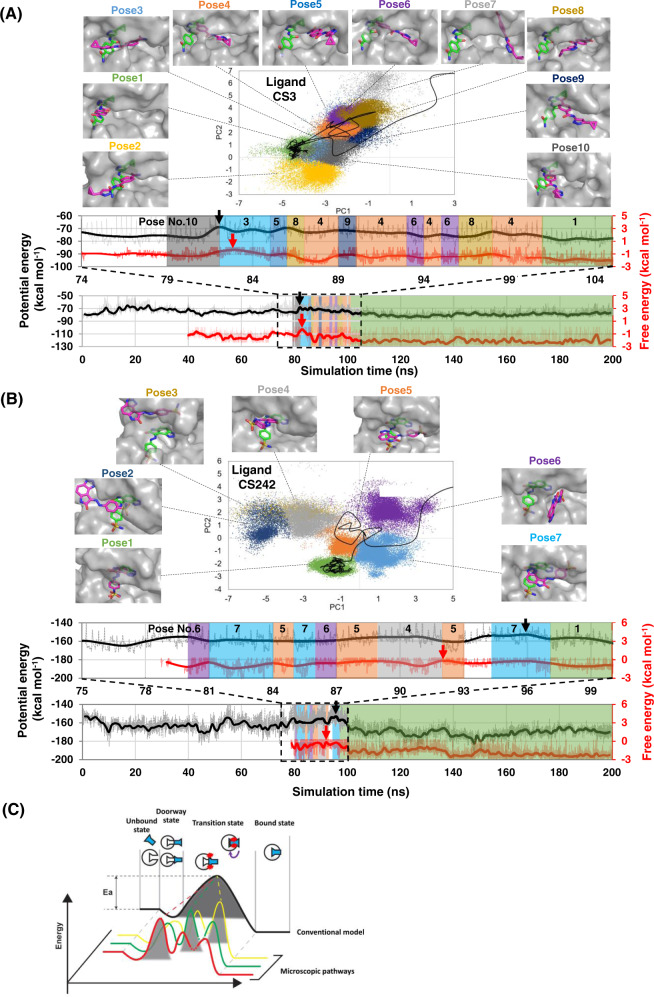
Fig. 2. Microscopic binding pathways of CDK2 inhibitors.
A, B Representative binding pathways of A CS3 and B CS242 ligands to the ATP-binding pocket of CDK2. (Top) Projections of binding conformations observed in the whole set of MD trajectories (colored dots) and of a representative binding pathway (black line) onto the first and second principal components (PC1 and PC2) calculated from principal component analysis (PCA). Ten (CS3) and 7 (CS242) representative binding poses (magenta sticks) on CDK2 (gray surfaces) are shown alongside the crystallographic pose (green sticks), the closest conformation to which was assigned as Pose 1. (Bottom) Potential energy (black) and free energy (red) trajectories corresponding to the pathway shown in the PCA map. The highest-energy transition state is indicated by a black (potential energy) or red (free energy) arrow. The upper panel shows an enlarged view of these trajectories close to the highest-energy transition state. Note that transition states occur A immediately before/after the ligand enters the CDK2 pocket and B during conformational rearrangements taking place after pocket entry. C Schematic illustration of microscopic and macroscopic kinetic models. The conventional kinetic model assumes a single binding pathway with a single transition state. However, at the single-molecule level, the ligand binds to the protein through multiple pathways with different highest-energy transition state conformations.

