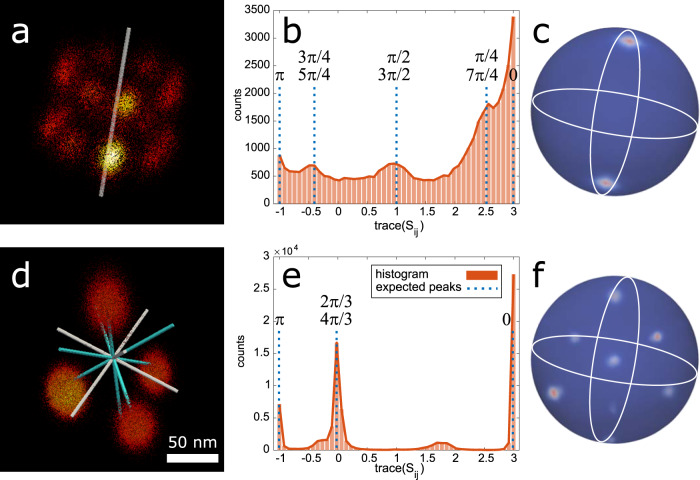
Fig. 3. Symmetry group detection from SMLM data.
a Fusion of 300 STORM Nup96 particles and the estimated rotational symmetry axis. b Histogram of the trace(Sij) reveals the 8-fold rotational symmetry of the Nup96 protein. c Density plot of the estimated axes of rotation on the unit sphere for the Nup96 dataset. d Fusion of 400 3D PAINT DNA-origami tetrahedron particles and the estimated axes of rotation. The white and cyan bars indicate the 3-fold and 2-fold rotational symmetry axes, respectively. e Histogram of the trace(Sij) reveals the 3- and 2-fold rotational symmetries of the tetrahedron structure. f Density plot of the estimated axes of rotation on the unit sphere. The dense regions on the unit sphere in c, f project the orientation of the estimated axis(es) of rotations.

