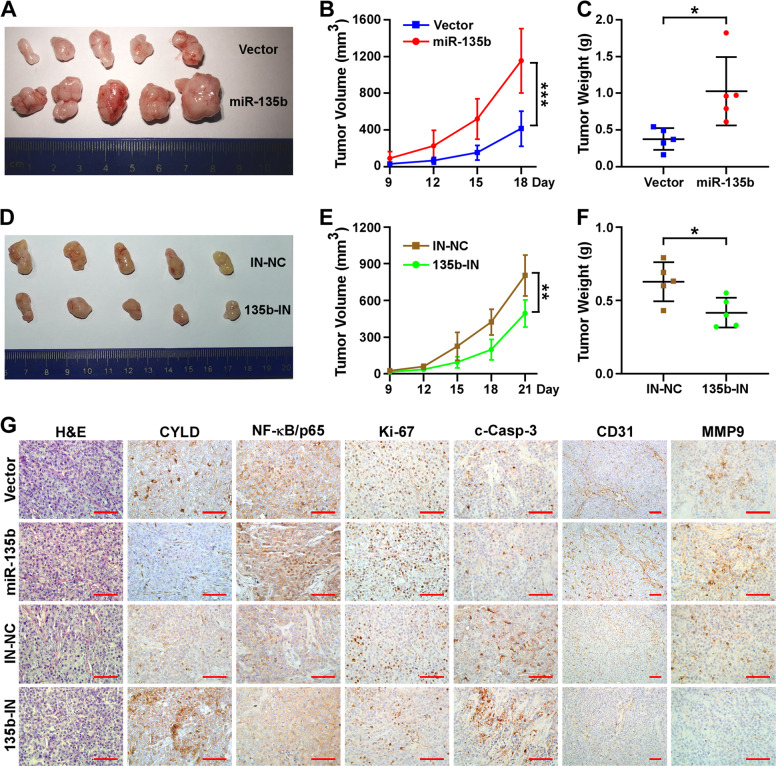
Fig. 7. miR-135b promotes tumor progression in vivo.
A, D Representative images of tumors from all of the mice in each group. B, E Growth curve of the tumor volumes measured on the indicated days. C, F Quantification of tumor weights. Error bars represent the mean ± SD. *p < 0.05; **p < 0.01; ***p < 0.001, two-tailed, unpaired t-test. G Representative pictures of H&E staining and IHC staining of CYLD, NF-kB/p65, Ki-67, cleaved-Casp-3, CD31 and MMP9 of the indicated group of tumors. Scale bars, 100 μm.

