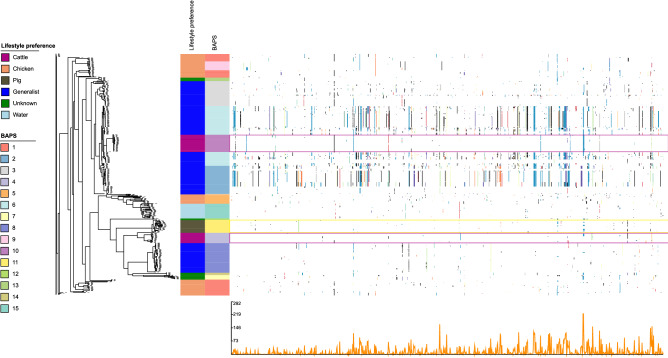
Figure 3.
Recombination profile of the core genome alignment of 490 C. jejuni isolates calculated by BRATNextGen and visualized in Phandango. The left side shows the core genome phylogeny. The metadata provide information about lifestyle preferences (association) and BAPS clusters. Significant recombinations are marked by coloured dots and lines. Purple and yellow boxes highlight cattle- and pig-associated BAPS clusters, respectively. Presence of dot of the same colour across multiple isolates within a column represents acquisition of the same recombinant segment, otherwise colours are arbitrary. The line graph at the bottom presents recombination prevalence along the genome sequence.

