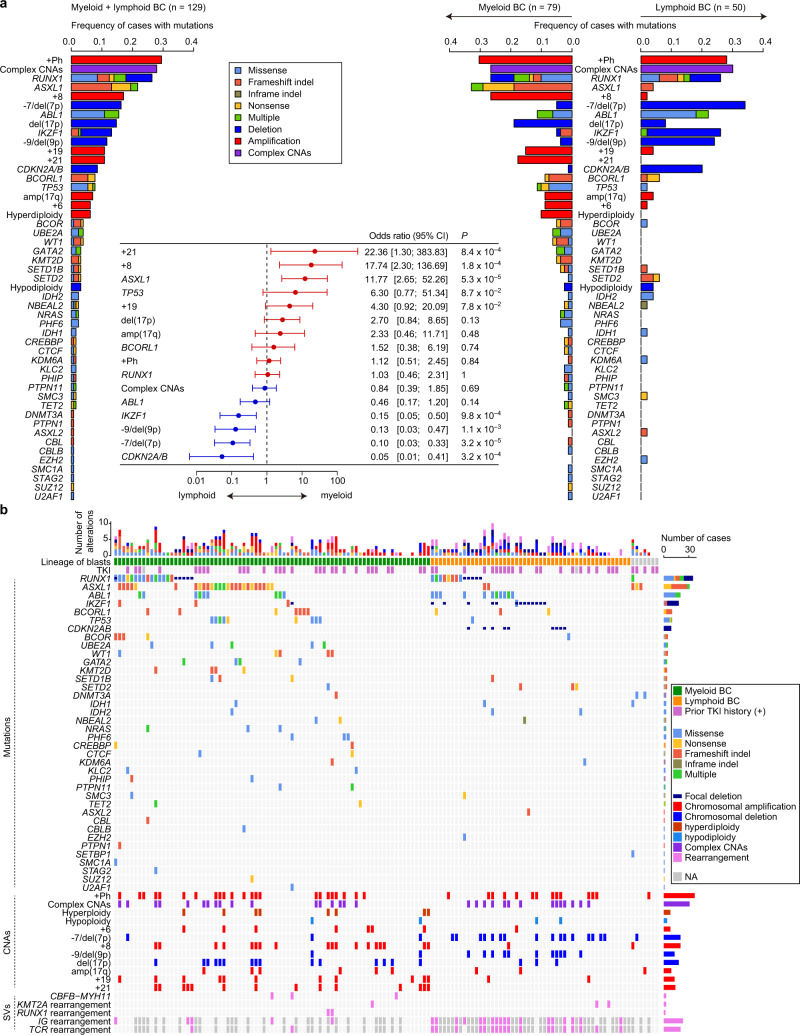
Fig. 3. Genetic landscape of myeloid and lymphoid BC in CML.
a Frequencies of mutations in 129 BC patients evaluable for blast lineage (left panel), and myeloid (n = 79) and lymphoid BC (n = 50) (right panel). Categories of mutations are depicted in different colours, and “multiple” indicates ≥2 distinct alterations found in the same gene in the same patient. The forest plot shows odds ratios with 95% confidence intervals (CI) for enrichment of each genetic lesion in myeloid BC. The dashed line represents an odds ratio of 1. Positive and negative odds ratios are indicated by red and blue colours, respectively. Genetic lesions found in >10 cases were included. P values were calculated using the Fisher’s exact test. b Summary of genetic lesions in all 136 BC patients. Each column indicates one patient. Lineage of blasts and prior history of TKI therapy before BC diagnosis are also shown. Categories of alterations are depicted in different colours, and “multiple” indicates ≥2 distinct mutations found in the same gene in the same patient. The rearrangement of immunoglobulin (IG) and T-cell receptor (TCR) genes is shown in cases analysed by WES. NA not available.

