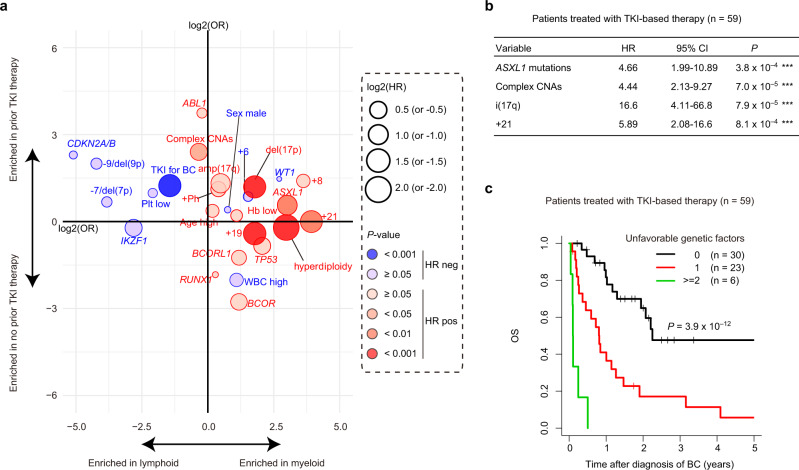
Fig. 5. Prognostic impact of each clinical or genetic factor in CML-BC.
a Summary of the relationship between individual clinical or genetic factors and lineage of BC, prior TKI history, and OS in 99 BC patients. Odds ratios for the enrichment of individual factors in myeloid lineage of BC and in the history of prior TKI therapy are represented in the horizontal and vertical axes, respectively. The size of the circles corresponds to the hazard ratio (HR) of the effect of each factor on the OS in the univariate analysis. Positive and negative HR values are shown as red and blue circles, respectively. The colour gradient indicates P values calculated by the Cox proportional hazards regression model in the univariate analysis. b Cox proportional hazards regression model with a stepwise variable selection identifying the independent risk factors, predicting OS in 59 patients treated with TKI-based therapy for BC. ***P < 0.001. c Kaplan–Meier survival curves for OS of 59 patients treated with TKI-based therapy for BC according to the number of unfavourable genetic factors listed in b. P values were calculated using the log-rank test.

