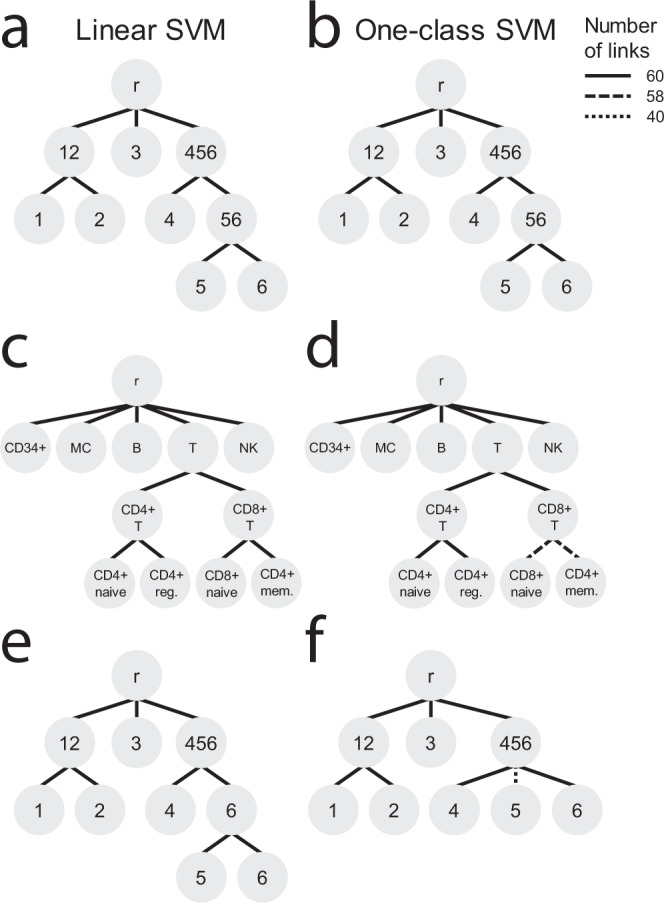
Fig. 4. Tree learning evaluation.

Classification trees learned when using a a, c, e linear SVM or b, d, f one-class SVM during the a, b simulated, c, d PBMC-FACS, and e, f simulated rejection experiment. The line pattern of the links indicates how often that link was learned during the 60 training runs. d In 2/60 trees, the link between the CD8+ T cells and the CD8+ naive and CD4+ memory T cells is missing. In those trees, the CD8+ T cells and CD8+ naive T cells have a perfect match and the CD4+ memory T cells are missing from the tree. f In 20/60 trees, the link between “Group456” and “Group5” is missing. In those trees, these two populations are a perfect match.
