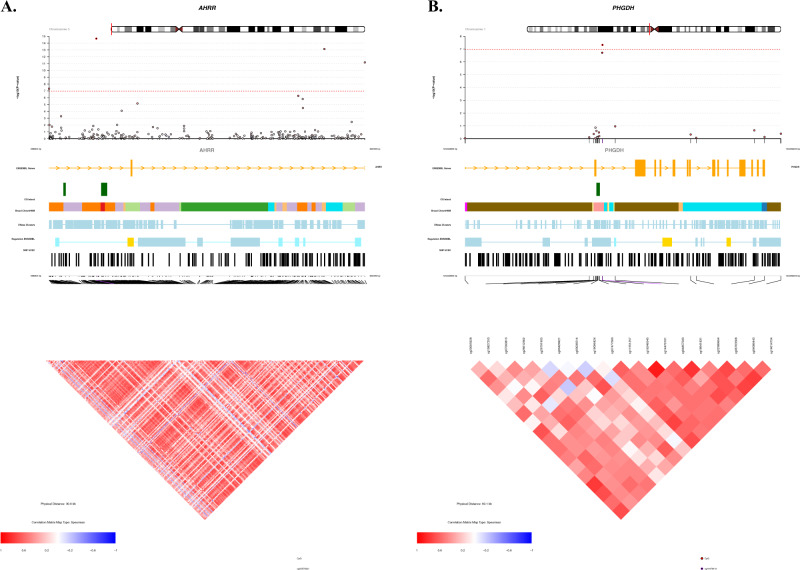
Fig. 3. The CoMET plots depicting genomic regions where the CpGs annotated to AHRR (A) and PHGDH (B) are located.
The x-axis indicates the position in base pair (bp) (hg19) for the region, while y-axis indicates the strength of association from EWAS with coffee consumption. The red line indicates the Bonferroni threshold for epigenome-wide significance (P = 1.1 × 10⁻⁷). The figure was computed using the R-based package CoMET, while the Ensembl is a genome database resource (http://ensemblgenomes.org/). The correlation of the surrounding CpGs was computed using methylation measures in the Rotterdam Study.

