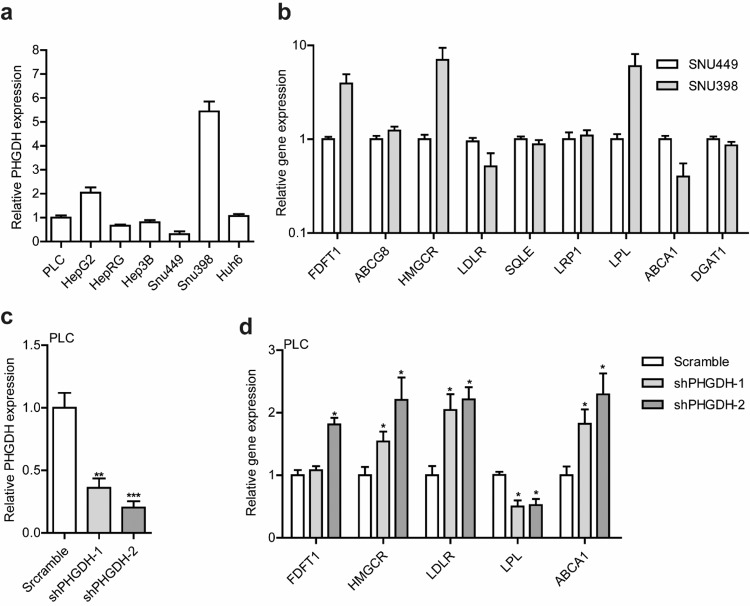
Fig. 4. PHGDH gene expression levels in liver cell lines and relative to expression levels of lipid-associated genes.
a Relative expression levels of PHGDH against a reference gene (GAPDH) in 7 human liver cell lines. Gene expression levels were quantified by qRT-PCR. Data were normalized to the PLC cell line (PLC, set as 1). b Relative expression levels of 9 lipid-associated genes in SNU499 cell line (with the lowest level of PHGDH expression) and SNU398 cell line (with the highest level of PHGDH expression) are shown. Relative gene expression levels were quantified by qRT-PCR. GAPDH serves as a reference gene, and gene expression levels in SNU449 cell line set as 1. This figure shows that, compared with SNU449 cells, SNU398 cells differentially express five of the lipid-associated genes (FDFT1, HMGCR, LDLR, LPL, and ABCA1). c Established PHGHD knockdown cell lines (shPHGHD-1 and -2), PLC cells transduced with lentiviral shRNA vectors targeting PHGDH or scramble control. qRT-PCR analysis of PHGDH expression were performed in stable knockdown or scramble control PLC cells. Data are normalized to the scramble control (scramble, set as 1). d Expression levels of five lipid-associated genes in stable PHGDH knockdown or scramble control PLC cells. Data were normalized to the scramble control (scramble, set as 1). The figure demonstrates that knockdown of PHGDH gene expression by lentiviral shRNA vectors resulted in significant decrease in the expression level of LPL and significant increase in the expression levels of LDLR and ABCA1 in both knockdown cells. Data in the figures are presented as mean values ± SEM of n = 3 biologically independent experiments. The Mann–Whitney U-test (two-sided) was used to compare differences between two independent groups. Differences were considered significant at P < 0.05, which indicated by * (**P < 0.01 and ***P < 0.001).

