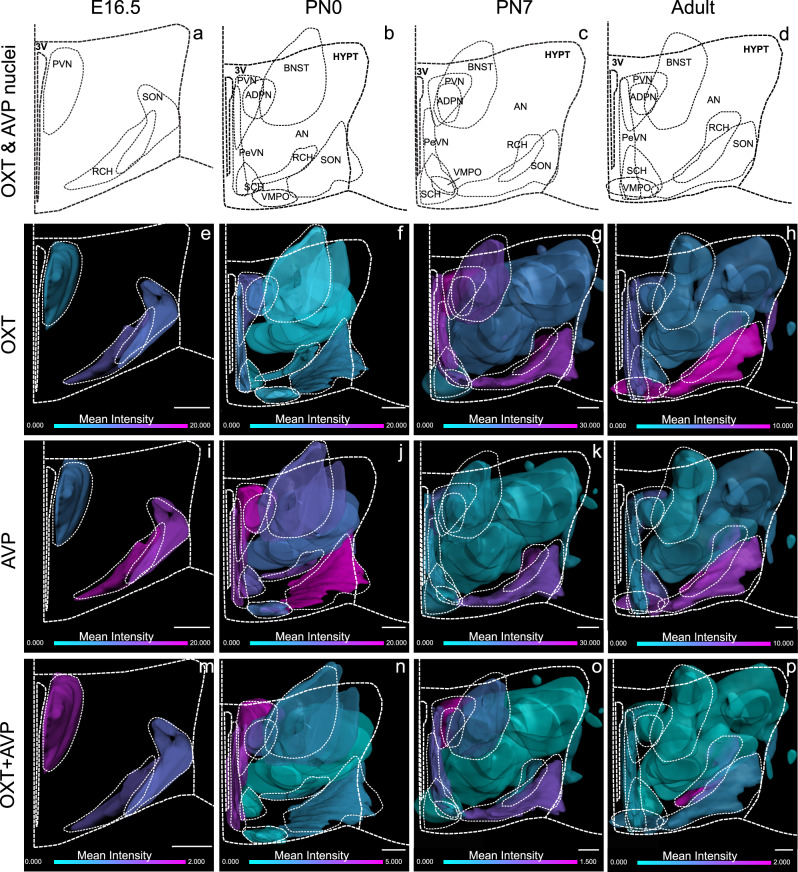
Fig. 3. OXT, AVP, and OXT + AVP cell density in the developing mouse hypothalamus.
3D hypothalamic flatmap representations of OTX (e–h), AVP (i–l) and OXT + AVP cells (m–p) in each nucleus at a range of developmental stages: E16.5 (a), PN0 (b), PN7 (c) and adult (d). Flatmaps show the expression intensity of each cell population at each developmental stage. Please note the difference intensity scale according to the developmental stage. The minimum intensity is represented in turquoise and the maximum in pink. 3v third ventricle, PeVN periventricular nucleus, ADPN anterodorsal preoptic nucleus, BNST bed nucleus of stria terminalis, VMPO ventromedial preoptic nucleus, SON supraoptic nucleus, PVN paraventricular nucleus, RCH retrochiasmatic area, AN accessory nucleus, SCH suprachiasmatic nucleus. Scale bar: 200 µm.

