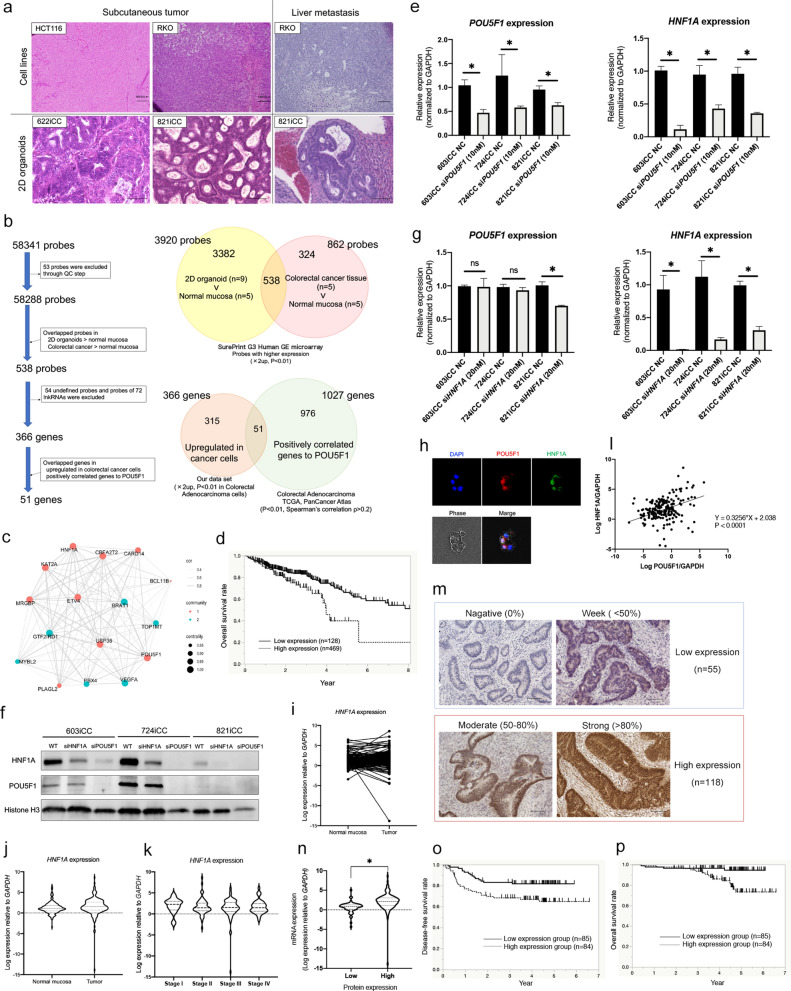
Figure 1.
HNF1A as a downstream of POU5F1 and its expression in clinical tissue specimens and prognosis. (a) H&E staining of xenograft tumors from cell lines (HCT116 and RKO) and primary cultured 2D organoids (2DOs) (622iCC and 821iCC). Histological examination of 2DO showed tubular adenocarcinoma in both subcutaneous tumors and liver metastasis. (b) Chart of selection of genes related to POU5F1 as a therapeutic target. A total of 366 genes (410 probes) were identified, which were higher in 2DOs than in normal mucosa, and higher in colorectal cancer than in normal mucosa (more than twofold, P < 0.01). Positively correlated 1027 genes to POU5F1 were selected from TCGA database (P < 0.01, Spearman’s correlation ρ > 0.2). Fifty-one genes overlapped in these data sets. (c) Gene network of extracted 16 genes was visualized based on a random graph of 16 nodes and a wiring probability of 0.3 resulting in 120 edges between nodes. Nodes are sized by degree of centrality and colored by community class. (d) Overall survival (OS) curves based on HNF1A mRNA expression from TCGA database. Patients with high HNF1A expression levels had a poor prognosis compared with low HNF1A expression (P = 0.004, log-rank test). (e) The reductions in POU5F1 and HNF1A expression were significant with POU5F1 siRNA (siPOU5F1) compared to levels in the siRNA negative control (NC) groups in all three 2DOs (n = 4). Values are presented as means ± SEM (*P < 0.05, Wilcoxon’s rank sum test). (f) Western blotting of HNF1A and POU5F1 in siPOU5F1 and si HNF1A three 2DOs. (g) The reductions in HNF1A expression were significant with HNF1A siRNA (siHNF1A) compared to levels in the siRNA negative control (NC) groups in all three 2DOs. The reductions in POU5F1 expression were not significant in 2 2DOs (n = 4). Values are presented as the means ± SEM (*P < 0.05, Wilcoxon’s rank sum test). (h) Immunocytochemistry of HNF1A and POU5F1 in cultured 2DO (603iCC). (i–l) HNF1A mRNA expression in 198 clinical tissue specimens. (i) HNF1A expression normalized to GAPDH expression in 198 tumor tissue and corresponding normal tissues was shown. (j) HNF1A expression in tumor tissues (median, 2.89) was higher than in the corresponding normal tissues (median, 2.08) (P = 0.001, Wilcoxon’s rank sum test). (k) HNF1A mRNA expression in tumor tissues was not correlated with TNM stage (Tukey’s test). (l) The correlation between HNF1A expression and POU5F1expression in tumor tissue. (m) HNF1A protein expression in clinical tissue specimens. HNF1A staining was mostly in nuclear. According to the staining area, 55 samples were classified into the low expression group and 118 were into the high expression group. Scale bars, 100 μm. (n) The correlation of HNF1A expression between mRNA expression and protein expression in tumor tissue (*P < 0.05, Wilcoxon’s rank sum test). (o) Disease-free survival (DFS) curves based on HNF1A mRNA expression. Five-year DFS rates in patients with high and low HNF1A expression levels were 65% and 82%, respectively (P = 0.014, log-rank test). (p) Overall survival (OS) curves based on HNF1A mRNA expression. Five-year OS rates in patients with high and low HNF1A expression levels were 73% and 95%, respectively (P = 0.004, log-rank test).

