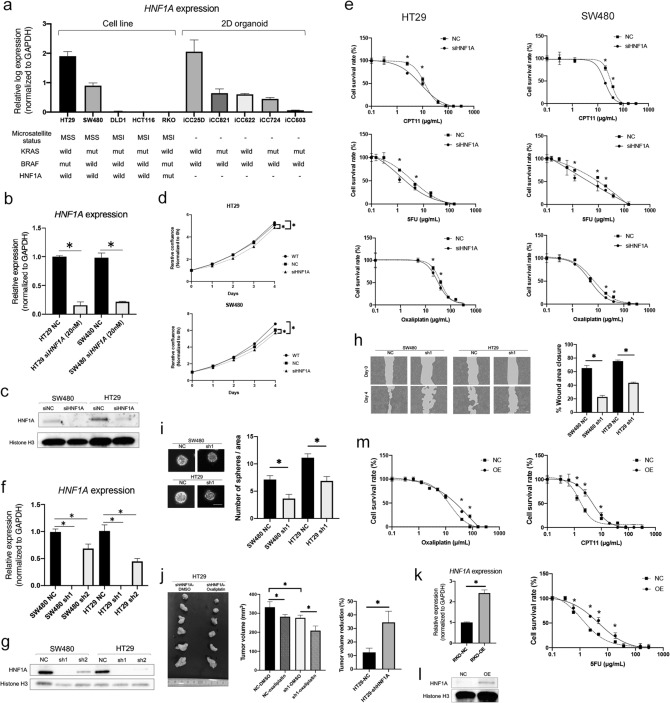
Figure 2.
HNF1A mRNA expression in colorectal cancer (CRC) cells and inhibition of HNF1A. (a) HNF1A mRNA expression was evaluated in five CRC cell lines and five primary cultured cells (n = 3). Values are presented as means ± SEM. Microsatellite status, KRAS mutation status, BRAF mutation status, and HNF1A mutation status of each cell lines were shown. (b) The reduction in HNF1A expression was significant with HNF1A siRNA (siHNF1A) compared to levels in the siRNA negative control (NC) in two cell lines (n = 4). Values are presented as the means ± SEM (*P < 0.05, Wilcoxon’s rank sum test). (c) Western blotting of HNF1A and NC in siRNA negative control (NC) and si HNF1A in two cell lines. (d) Proliferation assay after siRNA-mediated inhibition in two CRC cell lines. There were significant differences between WT or NC and siHNF1A groups (n = 6). Values are presented as the means ± SEM (*P < 0.05, Wilcoxon’s rank sum test.). (e) Drug-sensitivity assay after siRNA treatment based on two CRC cell lines. Drug sensitivity was improved in the siHNF1A group compared to in the NC group (n = 4). Values are presented as the means ± SEM (*P < 0.05, Wilcoxon’s rank sum test). (f) Tow HNF1A-specific small hairpin RNAs (shRNAs) were transduced into SW480 and HT29. HNF1A mRNA expression was significantly decreased in these cells (n = 3). Values are presented as means ± SEM (*P < 0.05, Wilcoxon’s rank sum test). (g) Western blotting showed HNF1A expression was decreased in HNF1A shRNA (sh1, sh2) compared with the negative control (NC). (h) Representative images of wound healing assay and wound closure were inhibited in HNF1A shRNA (sh1) compared with the negative control (NC) (n = 4). Values are presented as the means ± SEM (*P < 0.05, Wilcoxon’s rank sum test). (i) Representative images of spheres and the number of spheres was reduced in HNF1A shRNA (sh1) compared to the negative control (NC) (n = 8). Values are presented as the means ± SEM (*P < 0.05, Wilcoxon’s rank sum test). (j) Representative image of xenograft tumors of HNF1A shRNA cells with/without oxaliplatin treatment and the tumor volume was reduced in HNF1A shRNA cells (sh1) compared with the negative control (NC). Oxaliplatin treatment further reduced the size of tumor, especially in sh1 (n = 6). Values are presented as the means ± SEM (*P < 0.05, Wilcoxon’s rank sum test). (k) HNF1A mRNA expression was elevated in the doxycycline-induced HNF1A overexpressed RKO cells (OE) compared with negative control without doxycycline (NC) (n = 3). Values are presented as the means ± SEM (*P < 0.05, Wilcoxon’s rank sum test). (l) Western blotting of HNF1A in HNF1A overexpressed RKO cells (OE) compared with the negative control (NC). (m) Drug-sensitivity assay in HNF1A overexpressed RKO cells (OE) compared with rhe negative control (NC). Drug sensitivity decreased in the OE group compared to in the NC group (n = 4). Values are presented as the means ± SEM (*P < 0.05, Wilcoxon’s rank sum test).

