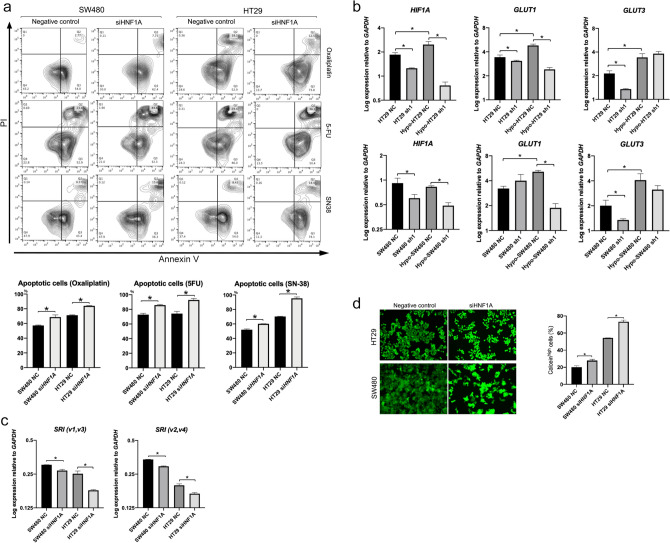
Figure 3.
Analysis of downstream of HNF1A. (a) Flow cytometric analysis of apoptosis. siHNF1A significantly increased the number of annexin V-expressing cells in response to oxaliplatin, 5-FU, and CPT-11 in both cell lines (n = 3). Values are presented as means ± SEM (*P < 0.05, Wilcoxon’s rank sum test.). (b) HIF1A, GLUT1, and GLUT3 expression was increased in hypoxia in HT29. GLUT1 and GLUT3 expression was increased in hypoxia (Hypo-) in SW480. There were significant differences in the expression of HIF1A and GLUT1 between the negative control (NC) and siHNF1A groups in hypoxia in both cell lines. There were no significant differences in the expression of GLUT3 in hypoxia in both cell lines (n = 4). Values are presented as the means ± SEM (*P < 0.05, Wilcoxon’s rank sum test.). (c) There were significant differences in the expression SRI, target gene of HNF1A, between negative control (NC) and siHNF1A groups (n = 4). Values are presented as the means ± SEM (*P < 0.05, Wilcoxon’s rank sum test.). (d) Representative images and flow cytometric analysis of multi-drug resistance assay. Calceinhigh cells (> 1 × 10⁵) significantly increased in the siHNF1A group compared with that in the NC group (n = 3). Values are presented as the means ± SEM (*P < 0.05, Wilcoxon’s rank sum test.).

