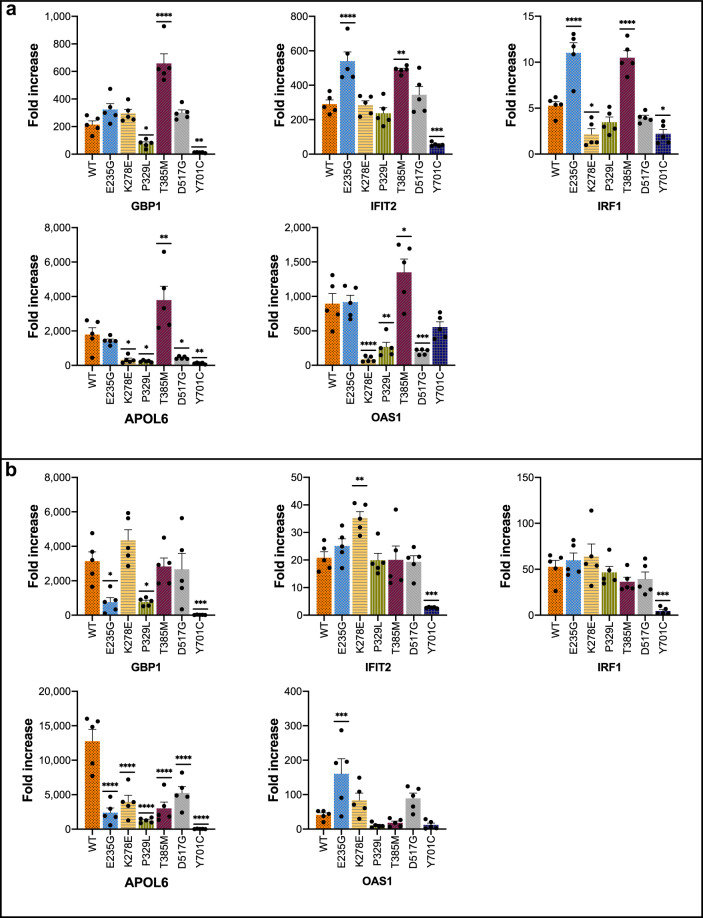
Fig. 4. Relative gene expression of interferon-stimulated genes (ISG) following IFNα or IFNγ stimulation.
mRNA expression levels were measured for five ISG (GBP1, IFIT2, IRF1, APOL6, OAS1) at baseline and following 6 h of stimulation with IFNα (a) or IFNγ (b). Expression levels were normalized to housekeeping GAPDH and plotted as fold increase from baseline. Pooled data from at least five experiments are presented. Data are represented as mean ± standard error of mean. Statistical analysis: one-way ANOVA with Dunnett’s post-hoc test (*p < 0.05, **p < 0.01, ***p < 0.001, ****p < 0.0001).

