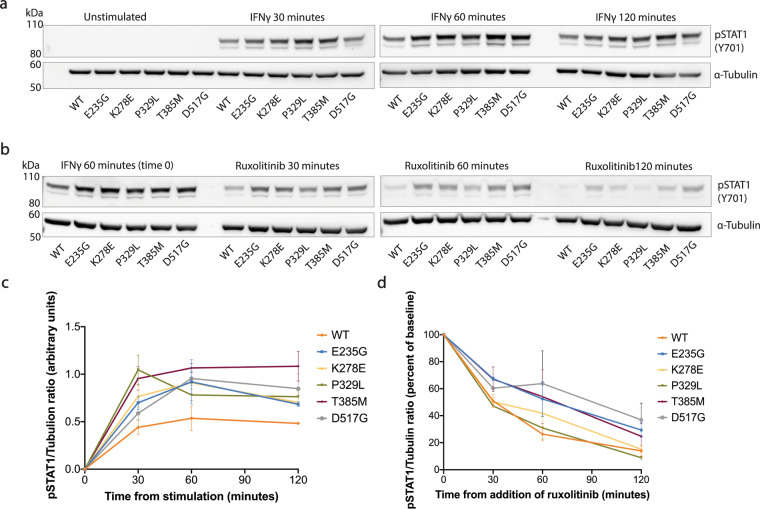
Fig. 5. Time-course analysis of STAT1 phosphorylation and de-phosphorylation among wild type and gain-of-function mutants following IFNγ stimulation.
a Levels of pSTAT1 were measured in whole-cell protein lysates at baseline, and following 30, 60, or 120 min of stimulation with IFNγ (10 ng/mL). Results were normalized to α-Tubulin loading control. b Levels of pSTAT1 were measured after 60 min of stimulation with IFNγ (10 ng/mL), and at 30, 60, or 120 min following addition of the Janus-kinase inhibitor, Ruxolitinib (10 μM). Experiments were performed in duplicates. Densitometry analysis results for the phosphorylation and de-phosphorylation assays above were graphed and are presented in panels c and d, respectively.

