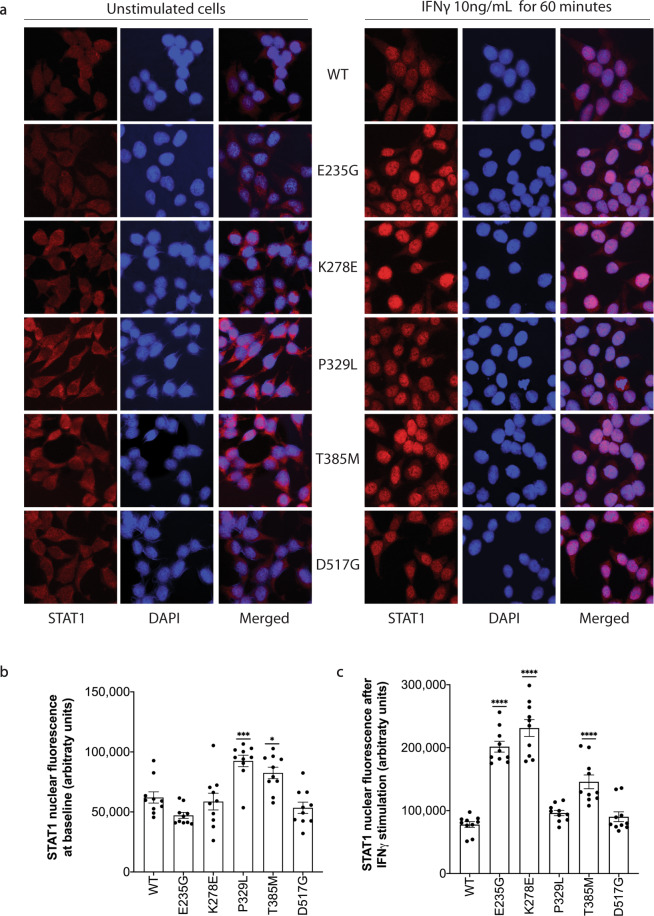
Fig. 6. Immunofluorescence analysis of STAT1 nuclear accumulation among wild type and gain-of-function mutants.
a Immunofluorescence assessing STAT1 nuclear localization was performed in cells at baseline (left) or following a 60-min stimulation with IFNγ (10 ng/mL). STAT1 is designated in red, while DAPI staining for nuclei is designated in blue. b Quantification of STAT1 from 10 nuclei per unstimulated sample. c Quantification of STAT1 from 10 nuclei per IFNγ-stimulated sample. Data are represented as mean ± standard error of mean. Statistical analysis: one-way ANOVA with Dunnett’s post hoc test (*p < 0.05, **p < 0.01, ***p < 0.001, ****p < 0.0001).

