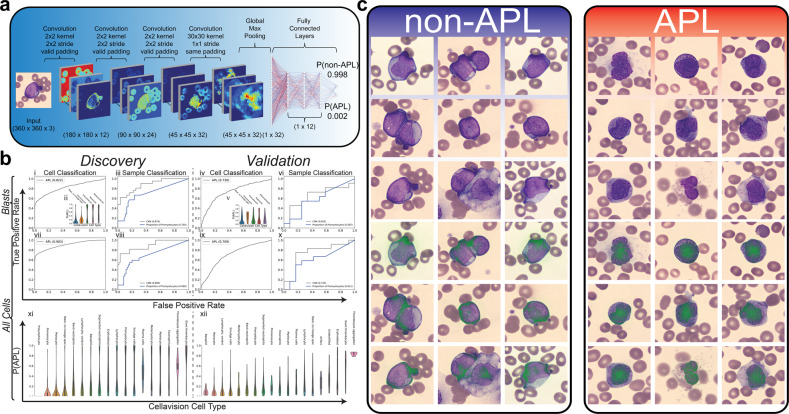
Fig. 1. Cell classification from peripheral smears.
a A deep learning architecture was designed to train cell-level classification of white blood cells taken from peripheral smears. The proposed model takes in each segmented cell from CellaVision and applies four convolutional layers before conducting a global max-pooling operation followed by three fully connected layers and one classification layer to classify each cell as being non-APL/APL. b The proposed model was trained where CellaVision data was available on a discovery cohort of 82 patients and tested on an independent prospective validation cohort of 24 patients for which performance metrics are shown. Initially, the model was trained only on immature myeloid cells, here denoted as Blasts, and performance was assessed both at the cell (i,iv) and sample/patient (iii,vi) level for the discovery and validation cohort. Performance was assessed in the discovery cohort in Monte–Carlo (MC) cross-validation and was assessed in the validation cohort by applying the 100 MC models trained in discovery onto the validation cohort in ensemble. Probability of a cell being APL is shown per CellaVision cell type (ii,v). Cell-level predictions were averaged over a given sample to arrive at a per-sample probability of being APL. Sample-level performance was benchmarked against the proportion of promyelocytes within a sample (iii,vi,viii,x). In addition, the model was trained on all cell types from CellaVision, here denoted as All Cells, and performance was assessed both at the cell (vii,ix) and sample/patient (viii,x) level for the discovery and validation cohort. Probability of being APL is shown for all CellaVision cell types in the discovery (xi) and validation (xii) cohorts. c After the trained model was applied to the blasts of the validation cohort to assess performance, per-cell predictions were collected and most predictive cells for non-APL/APL were collected and visualized (top row). In addition, integrated gradients were applied to localize the discriminative pixels to provide further information about how the model classified a given cell (bottom row).

