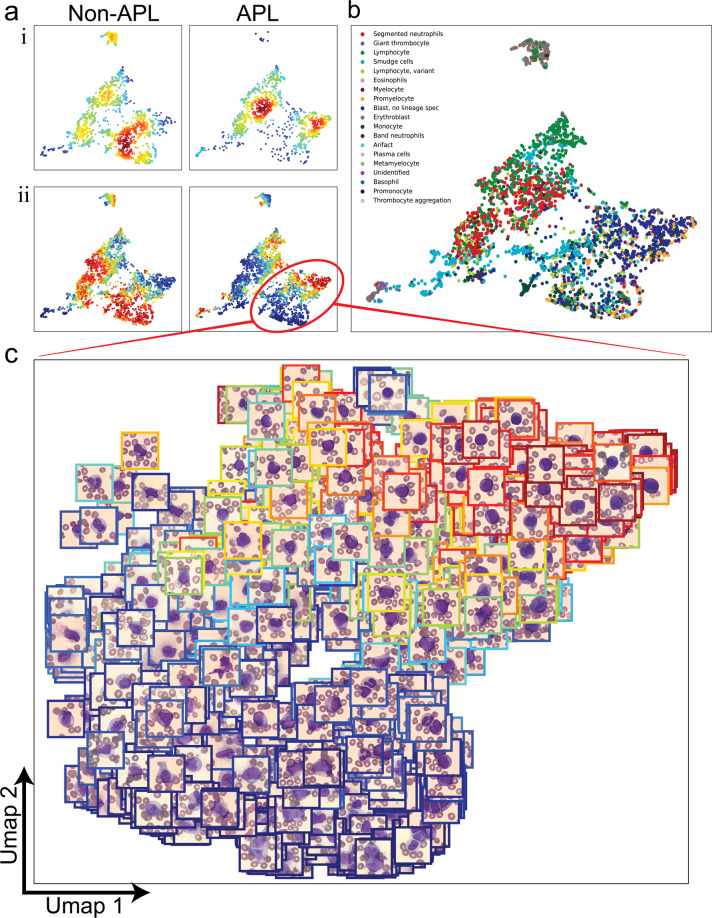
Fig. 3. UMAP representation of learned feature space.
a Per-cell features were obtained by extracting the outputs of the last 4 layers of the trained MIL neural network on all cells in the validation cohort and dimensionality reduction via PCA followed by UMAP was applied to create visualizations. (i) Cells were stratified by non-APL/APL labels and kernel density estimations were calculated to visualize the distribution of cells in this learned feature space where red denotes high-density and blue denotes low-density areas. (ii) Per-cell predictions were extracted from the network and were visualized within UMAP representation (red = high probability, blue = low probability). b UMAP labeled by CellaVision cell types. c Selected area in UMAP corresponding to immature myeloid cells is highlighted with cell images in respective UMAP coordinates. Color of the surrounding box corresponds to the cell-level probability of being APL (red = high probability of APL, blue = low probability of APL).

