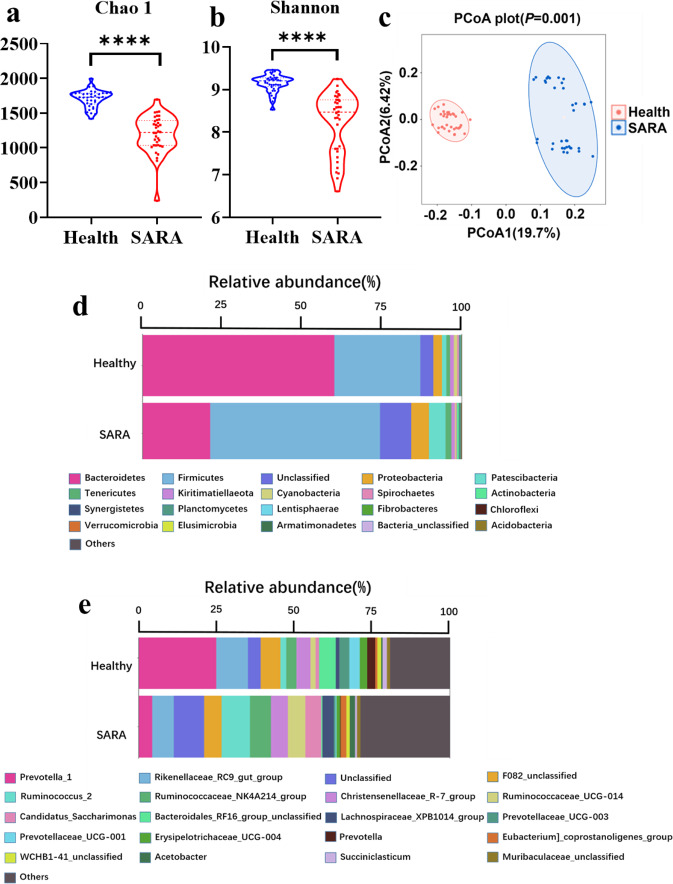
Fig. 2. Rumen microbial composition of two groups of dairy goat donors.
a The Chao 1 index and b the Shannon index of rumen microbiomes from two groups of dairy goat donors. A Mann–Whitney U test was carried out for comparing the two groups a, b. c Principal Coordinate Analysis (PCoA) of rumen microbiomes from two groups of dairy goat donors. The data was statistically analyzed based on ANOSIM analysis. d Average relative abundance of microbiota at the phylum level and e average relative abundance of microbiota at the genus level in SARA and healthy groups; Those bacteria whose relative abundance was less than 1% were classified as others. Health: rumen microorganisms from every hour for 6 consecutive hours after morning feeding of healthy dairy goats, SARA: rumen microorganisms from every hour for 6 consecutive hours after morning feeding of SARA dairy goats. *Indicates the difference is at a significant level with p < 0.05, **indicates the difference is at a significant level with p < 0.01. Error bars on the graphs represent standard error.

