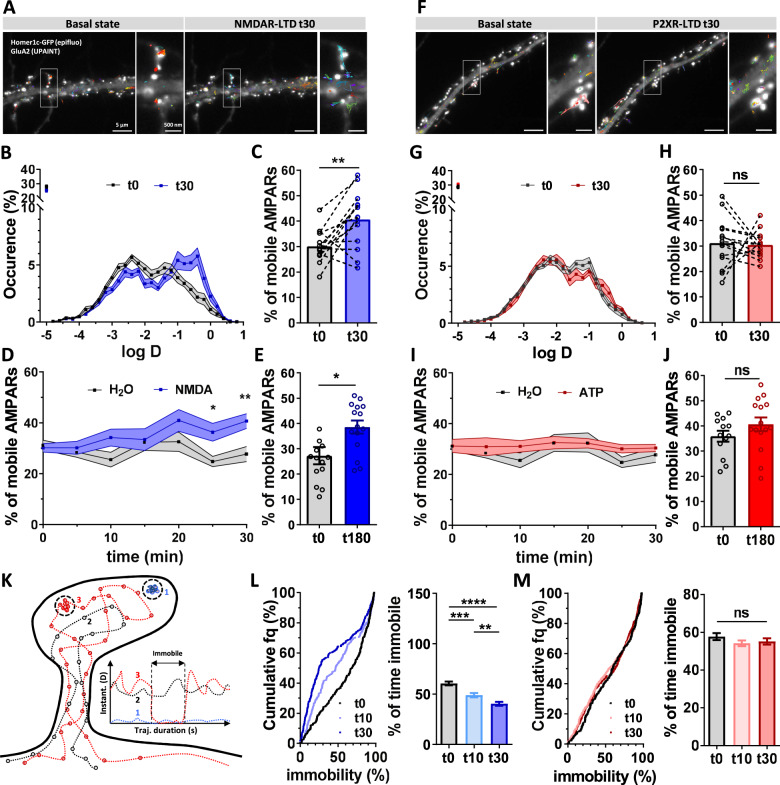
Fig. 2. NMDAR-dependent LTD but not P2XR-dependent LTD triggers a long-term increase of AMPAR lateral diffusion.
A Epifluorescence image of a dendritic segment expressing eGFP-Homer1c as a synaptic marker and GluA2-containing AMPAR trajectories acquired with uPAINT in basal state (left panel) and 30 min after NMDA treatment (right panel). B Average distribution of the log(D) (mean ± SEM), (D being the diffusion coefficient of endogenous AMPAR) in control condition (black line, n = 14) and 30 min after NMDA treatment (blue line, n = 14). C Average of the mobile fraction per cell, before and 30 min after NMDAR-dependent LTD induction (n = 14 cells, mean ± SEM, paired t-test, p = 0.0042). D Time-lapse (from 0 to 30 min) of GluA2-containing AMPAR mobility following NMDAR-dependent LTD induction (blue line) compared to vehicle application (green line) (mean ± SEM, n = 14 and 10 respectively). A significant increase of GluA2-containing AMPAR occurs 25 min after NMDA application. E Average histograms of the mobile fraction per cell, before and 180 min after NMDAR-dependent LTD induction (n = 14 and 15 cells, mean ± SEM, unpaired t-test, p = 0.0123). GluA2-containing AMPAR increased mobility remains stable for at least 3 h. F–J Similar experiments as from (A–E) has been realized with ATP-induced LTD protocol. F Epifluorescence image of a dendritic segment expressing eGFP-Homer1c with acquired trajectories of GluA2-containing AMPAR trajectories in basal state (left panel) and 30 min after ATP treatment (right panel). G Average distribution of the log (D) before (black line, n = 14) and 30 min (red line, n = 14) after ATP treatment (mean ± SEM). H Average of the mobile fraction per cell extracted from (G), (n = 14 cells, mean ± SEM, paired t-test, p = 0.8234). Contrary to NMDA-induced LTD, ATP-induced LTD is not associated with an increase of AMPAR mobility. I Time-lapse (from 0 to 30 min) of AMPAR mobility following P2XR-dependent LTD induction (red line) compared to vehicle application (green line) (mean ± SEM, n = 14 and 10 respectively). J Average histograms of the mobile fraction per cell, before and 180 min after P2XR-dependent LTD induction (n = 13 and 15 cells, mean ± SEM, unpaired t-test, p = 0.1950). No modification of AMPAR mobility is observed all along the 3 h experiments. K Scheme of the various AMPAR trajectory behaviors. AMPAR can be fully immobile (1, blue line), fully mobile (2 dark line) or alternate between mobile and immobile (3, red line). Calculation of the % of immobility all along the trajectory duration give an indication of the avidity of AMPAR for their molecular traps. L Variation of the % of AMPAR mobility per synaptic trajectories after NMDAR treatment (control (black line), 10 min (light blue line) and 30 min (dark blue line)). The left panel represents the cumulative distribution and the right panel the mean ± SEM. (n = 252, 235 and 280 synaptic trajectories respectively, one-way ANOVA p < 0.0001 and Tukey’s post-test found significant differences p = 0.0002 and p < 0.0001 between t0 and t10, and t0 and t30 respectively, and p = 0.0081 between t10 and t30). M Variation of the % of AMPAR mobility per synaptic trajectories during ATP-induced LTD (control (black line), 10 min (light red line) and 30 min (dark red line) following LTD induction). The left panel represents the cumulative distribution and the right panel the mean ± SEM (n = 264, 434 and 326 synaptic trajectories respectively, one-way ANOVA p = 0.3360). Scale bars (A and F): 5 µm, and 500 nm for the zoom image on synapses.

