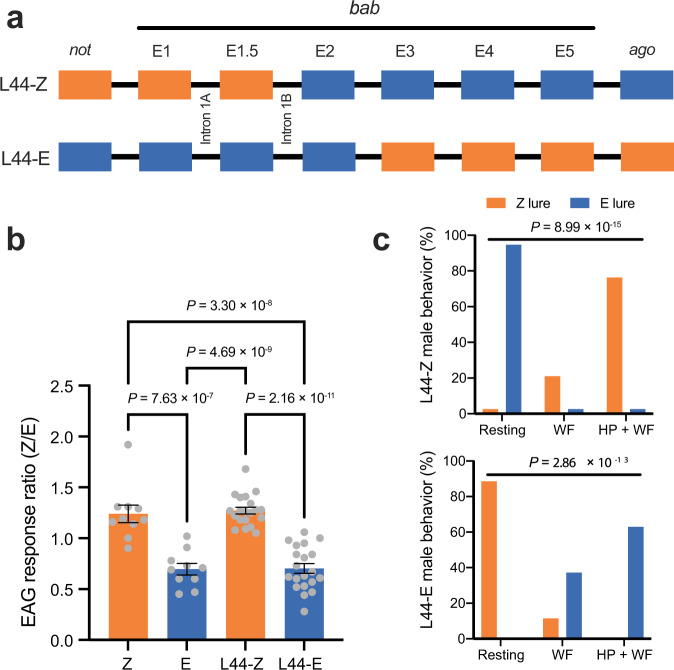
Fig. 2. Electrophysiological and behavioral analysis of bab-recombinant lines.
a Crossover points relative to exons of bab within lines L44-Z and L44-E. Boxes represent exons 1–5, orange gene regions originated from the Z-strain and blue from the E-strain. Locations of introns 1A and 1B are noted. Flanking genes ago and not are each represented by a single box. b Electroantennogram (EAG) response ratio of pure strain and bab-recombinant males. Data are presented as mean ± SEM of EAG response (in mV) to Z11-14:OAc divided by response to E11-14:OAc. Sample sizes of measured animals are Z-strain n = 10, E-strain n = 10, L44-Z n = 20, L44-E n = 20. Z-strain and Z-like responses are shown in orange, E-strain and E-like responses are shown in blue. P values report results of two-sided Tukey’s HSD post-hoc tests after an ANOVA (F = 38.67, df = 3, P = 1.13 × 10⁻¹³). c Wind tunnel responses of L44-E and L44-Z males to the Z-strain pheromone lure (97% Z-isomer, 3% E-isomer) are shown in orange and to the E-strain lure (1% Z-isomer, 99% E-isomer) in blue. P values report results of chi-square tests for L44-Z (χ2 (2, n = 38 animals) = 64.89) and L44-E (χ2 (2, n = 35 animals) = 57.76). Resting, no response to pheromone; WF wing-fanning response to pheromone, HP + WF wing-fanning and hair-pencil extrusion response to pheromone. Source data are provided as a Source Data file.

