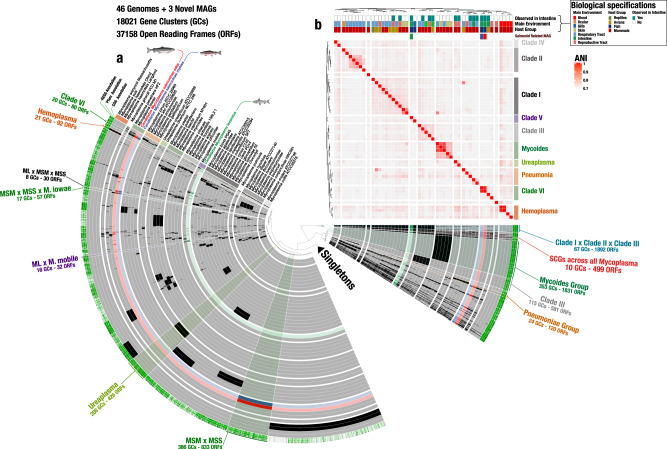
Fig. 3. Comparative genomics of three salmonid co-assembled MAGs with 49 different Mycoplasma genomes.
a Circle diagram based on presence/absence of the 18,021 gene clusters (GCs) containing one or more genes contributed by one or more isolated genomes. Bars in the 49 layers indicate the occurrence of GCs in a given isolated genome and MAGs, black bars indicate presence of GCs, whereas grey indicates absence. Blue, red and green font and layer colour indicate the salmonid MAGs of Candidatus Mycoplasma salmoninae mykiss, Candidatus Mycoplasma salmoninae salar, and Candidatus Mycoplasma lavaretus, respectively. GCs are organised based on their distribution across genomes, and layers of genomes are organised based on their average nucleotide identity (ANI), using Euclidean distance and ward ordination. Selections of co-clustering of genomes were presented in the outer layer and annotations were coloured according to previous clade colours and ANI clusters. Dark red notation indicates single copy core genes (SCGs) between all genomes and MAGs. b Heatmap indicates ANI clusters of Mycoplasma, where red indicates higher similarity between genomes. Colouring of ANI clusters follows the clade definitions shown in the description in Fig. 2. Biological specifications: The three rows describe the biological designation for each genome, including intestinal relation, main environment and host group.

