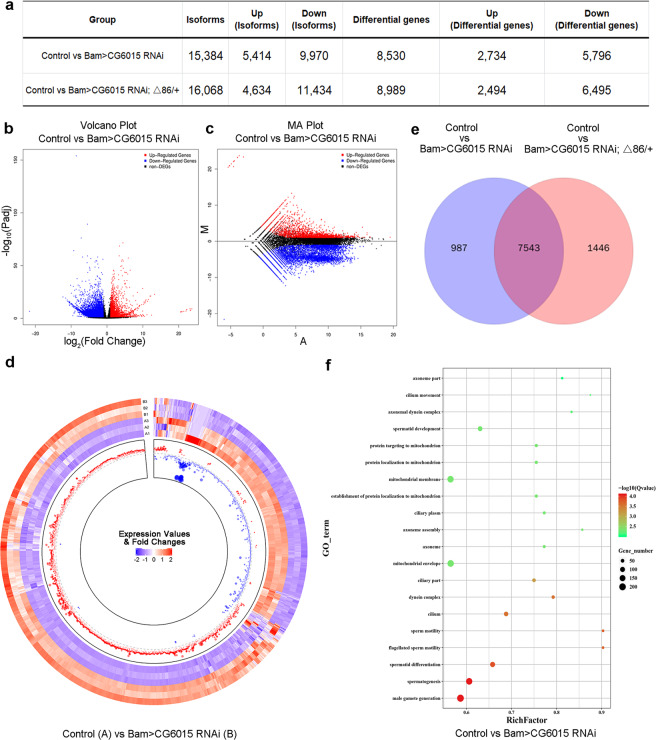
Fig. 4. Reduction of CG6015 in spermatogonia induced transcript alterations as assessed using RNA-seq analysis.
a Number of isoforms and genes identified by the RNA-seq in testes. b Volcano plots based on –log10Padj and log2FC from the comparison of the control (W1118) and Bam>CG6015 RNAi groups. c MA plots from the comparison of the control (W1118) and Bam>CG6015 RNAi groups. d Circular heatmap of differentially expressed genes from the comparison of the control (W1118) and Bam>CG6015 RNAi groups. The outer and inner tracks represent the expression values and fold changes, respectively. For both the expression value and fold change, blue and red scales represented low and high expression correspondingly. e Venn diagrams comparing the sets of differentially expressed genes. f GO analysis of the sets of differentially expressed genes from the comparison of the control (W1118) and Bam>CG6015 RNAi groups.

