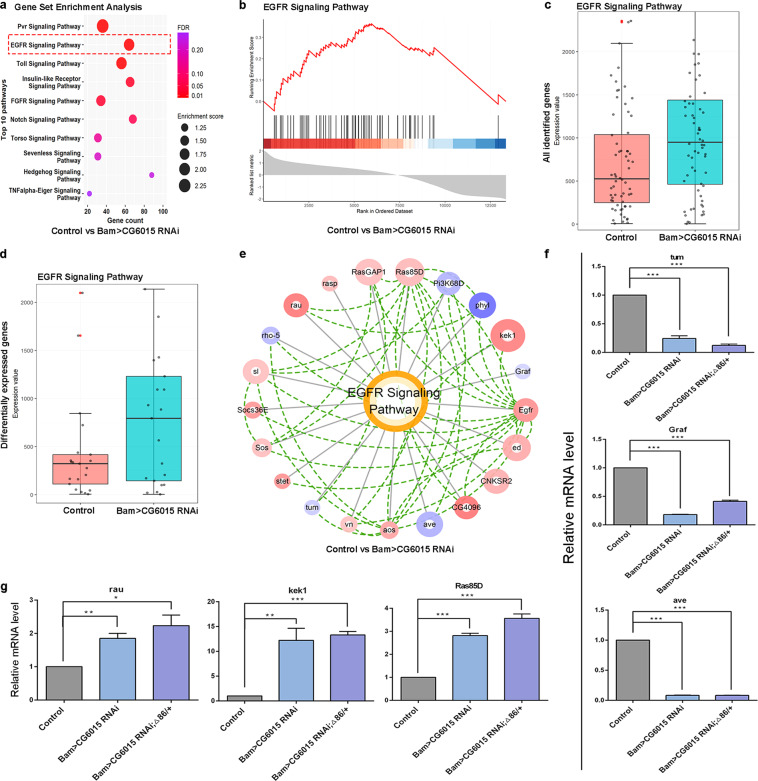
Fig. 5. Inferred signaling pathways and CG6015-mediated regulators during spermatogonia TA-divisions.
a Dot plots of the top 10 enriched pathways by GSEA from the comparisons of the control vs. Bam>CG6015 RNAi testes. Color scale and dot size represent FDR value and enrichment score, respectively. b Enrichment plot for the EGFR pathway from the comparisons of the control vs. Bam>CG6015 RNAi testes. Enrichment plot showing the distribution of the enrichment score, leading genes, and ranked list metric. c Box plots of EGFR signaling for all identified genes from the comparisons of the control vs. Bam>CG6015 RNAi testes. d Box plots of EGFR signaling for differentially expressed genes from the comparisons of the control vs. Bam>CG6015 RNAi testes. e Expression-interaction network of the EGFR signaling pathway from the comparisons of the control vs. Bam>CG6015 RNAi testes. Blue and red scales represented low and high expression, respectively, while the circle size is proportional to the statistical significance (-logFDR). Green lines represented protein interactions. f Relative mRNA level of representative down-regulated genes in the control, Bam>CG6015 RNAi and Bam>CG6015 RNAi; Δ86/+ testes. g Relative mRNA levels of representative upregulated genes in the control, Bam>CG6015 RNAi and Bam>CG6015 RNAi; Δ86/+ testes. *P < 0.05, **P < 0.01, ***P < 0.001.

