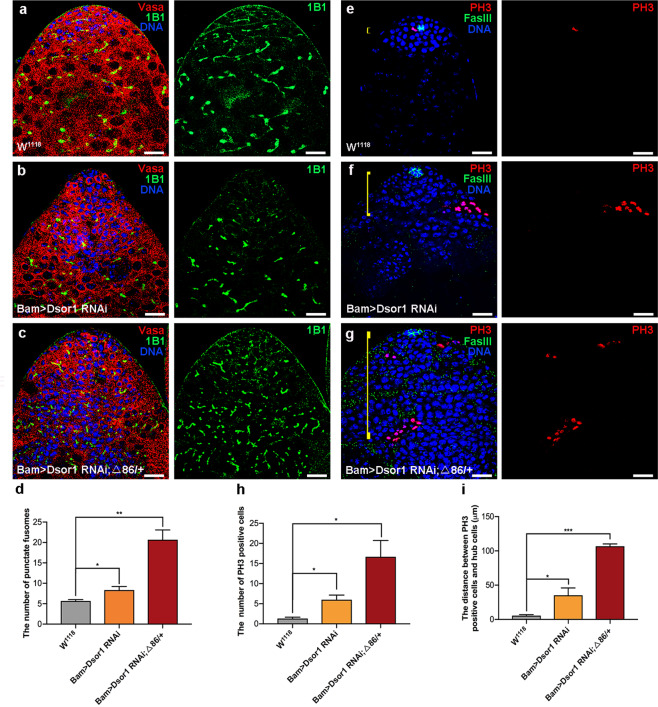
Fig. 7. Downregulation of Dsor1 in spermatogonia resulted in germline differentiation defects.
a–c Immunostaining of Vasa (red) and 1B1 (green) at the apex of W1118, Bam>Dsor1 RNAi, and Bam>Dsor1 RNAi; Δ86/+ testes. d The number of punctate fusomes in W1118 (n = 3), Bam>Dsor1 RNAi (n = 3), and Bam>Dsor1 RNAi; Δ86/+ (n = 3) testes. e–g Immunostaining of PH3 (red) and FasIII (green) at the apex of W1118, Bam>Dsor1 RNAi, and Bam>Dsor1 RNAi; Δ86/+ testes. Yellow lines represent the distance between PH3-positive cells and hub cells. h The number of PH3-positive cells in W1118 (n = 3), Bam>Dsor1 RNAi (n = 3), and Bam>Dsor1 RNAi; Δ86/+ (n = 3) testes. i The distance between PH3-positive cells and hub cells in W1118 (n = 3), Bam>Dsor1 RNAi (n = 3), and Bam>Dsor1 RNAi; Δ86/+ (n = 3) testes. DNA was stained with Hoechst (blue). *P < 0.05, **P < 0.01, ***P < 0.001. Scale bars: 20 µm.

